
Techstep has graduated from Klient University!
Congratulations to the Techstep team for their graduation from Klient University, LIVE on Klient psa within just a few weeks, very well done!!

Congratulations to the Techstep team for their graduation from Klient University, LIVE on Klient psa within just a few weeks, very well done!!

Congratulations to the Rosov Consulting team for their graduation from Klient University, LIVE on Klient psa within just a few weeks, very well done!!

Congratulations to the cee (Center for Energy and Environment) team for their graduation from Klient University, LIVE on Klient psa within just a few weeks, very well done!!

Congratulations to the R3 team for their graduation from Klient University, LIVE on Klient psa within just a few weeks, very well done!!


Maybe the screw fell out of your glasses, but you don’t have one of those tiny screwdrivers you need to replace it. You try the edge of your credit card, a thumb tack from the wall, a paper-clip you bent into a point.
Maybe you find a solution, or maybe you don’t. Either way, it’s annoying. Plus, it takes far more time, energy, and effort to fix than it would if you had the right tool.
The difference between project management and basic to-do lists is huge, yet it is a difference that’s often misunderstood. Post-it notes. Moleskine notebooks. Day-planners. Google docs. Any of the hundreds of organizational apps you can download to your phone. These are all versions of to-do lists. They can be very good at organizing individual projects, and there’s nothing wrong with keeping a running list of personal to-do items. However, basic to-do lists are not good for team projects because they fail to provide the one thing every team needs to keep a project moving forward: Visibility.
If you’re managing a team, it’s vital that you understand what everyone is working on. But if everyone on your team is working from his or her own personal to-do list, you’ll have little visibility into what’s actually happening on your team most of the time.
When everyone is working off their own lists, you have zero visibility of what’s getting done, what’s not getting done, who’s going to do what next, or what resources might be available to meet an unexpected need if one arises.
Projects rarely go from start to finish without a few changes to the overall requirements. If you’re not working from a team-based project management system, you’ll have to pull everyone together, see where everyone is on their tasks, then figure out what work needs to continue, what needs to change, and what can be stopped completely.
Project managers are in charge of getting projects done. But when you don’t know exactly when different parts of a project are going to be complete, it’s difficult to be confident that your project will get done on time. Will the different team members get their part of the project done? Will you have to bug them about it as their individual deadlines come due? That uncertainty can easily lead to feelings of anxiety for project managers.
It’s no fun to be a project manager who has to constantly bug team members about tasks, deadlines, or overdue deliverables. Likewise, if you’re a team member struggling to complete your part of a project, the last thing you need is an email from your project manager with the subject line “Status?” This kind of “project management by status update” process can quickly become a source of tension between employees and managers.
Your team is working on a project. But your boss just came in with something urgent. Does your team have the bandwidth to complete the task? How long will it take? Will it require overtime? What will be the impact on the other projects your team is working on? Without a clear view of your team’s activities, these questions won’t be easy to answer.
In teams with a good project management system, the status of everyone’s work is easy to see. The project manager will have reliable, easy-to-use project management software and will be able to see everything that’s happening with your projects. If you sell consulting as a service, you’ll also be able to use professional services automation (PSA) to see and schedule the resources your company has available to deliver your services. It’s no fun to work on a team where everyone feels like there’s too much to do and not enough time to do it. If you know the frustration of trying to keep your team on track without a good project management system, there are tools that can help.
Project management software will help your team work smarter, together. We hope you’ll consider trying ours, which can help any team get more work done in less time with less stress for everyone.

You liked this Klient Tip? Share it with your team!

Run your entire SaaS and consulting business on a single professional service automation platform native to Salesforce!

Congratulations to the InCloud team for their graduation from Klient University, LIVE on Klient psa within just a few weeks, very well done!!
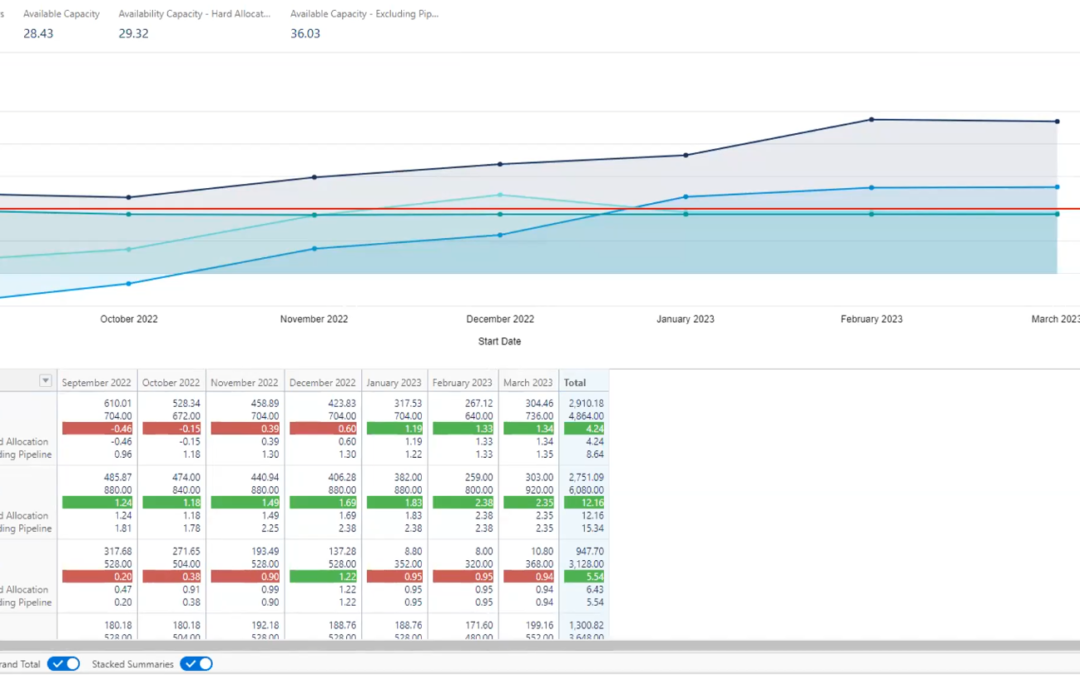
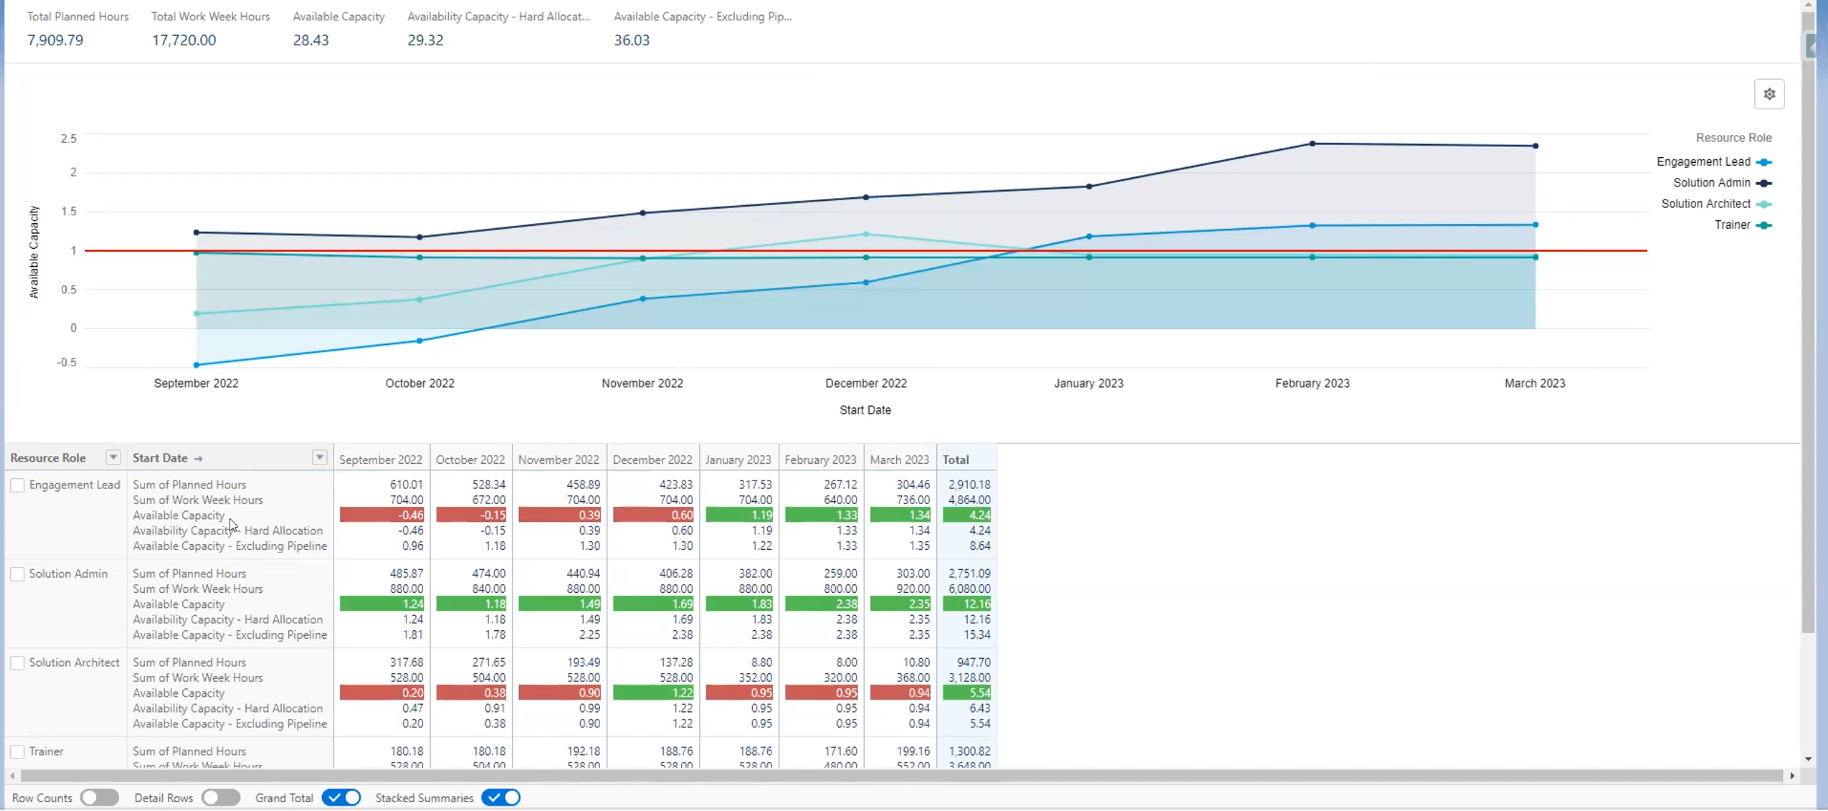
I’ve worked for 4 years in professional services within the management committee and many more in the software industry. From this experience, I wrote a list of all my favorite professional services KPIs I would use as part of a Professional Services Firms management committee.
In Gino Wickman’s book, Traction®, there is a theory that each manager should own a number – in other words, a KPI.
Below is a great list to find the KPI that you want to grow in your professional services firm. I’ve split the list into 4 categories:
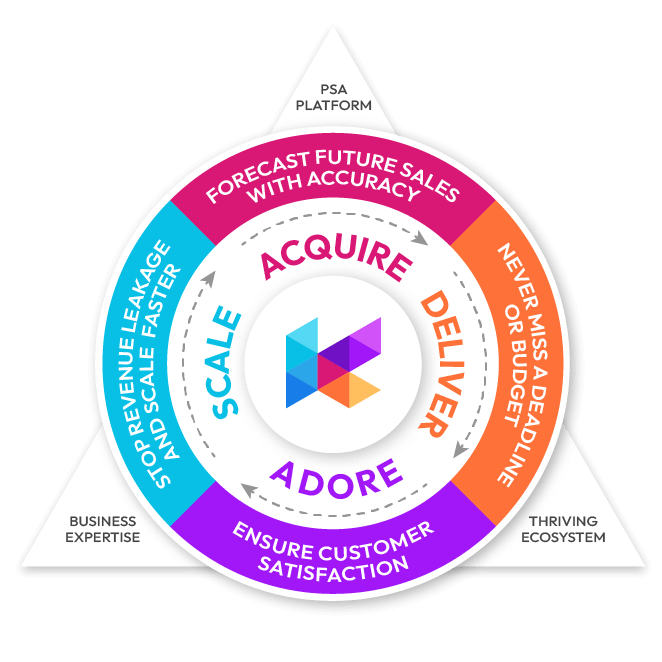
The KPIs come from various sources, my own experience in the industry, and the 2022 Professional Services Maturity™ Benchmark by Service Performance Insight.
And I’ll be using a few examples from our software, Klient PSA, to illustrate.
Enjoy 🙂
Try Klient Risk-FreeCustomer acquisition can be a tricky business. You want to attract new customers, but you don’t want to give away too much in terms of marketing and sales incentives.
After all, you want them to buy from you because they see the value in what you’re offering, not because you’re offering a deep discount.
Lead generation is often the first step in the customer acquisition process. By generating leads – potential customers who have expressed an interest in your service – you can start to build a relationship with them and eventually persuade them to buy from you.
Keep track of your sales. To get a percentage, divide (current earnings – previous earnings) by previous earnings, then multiply by 100. Sales growth is measured annually, but you can measure it monthly or quarterly.
Relevant revenue growth is unaffected by monthly seasonal swings. Organizations with seasonal revenue should measure sales increase in the same month (or season) as the previous year.
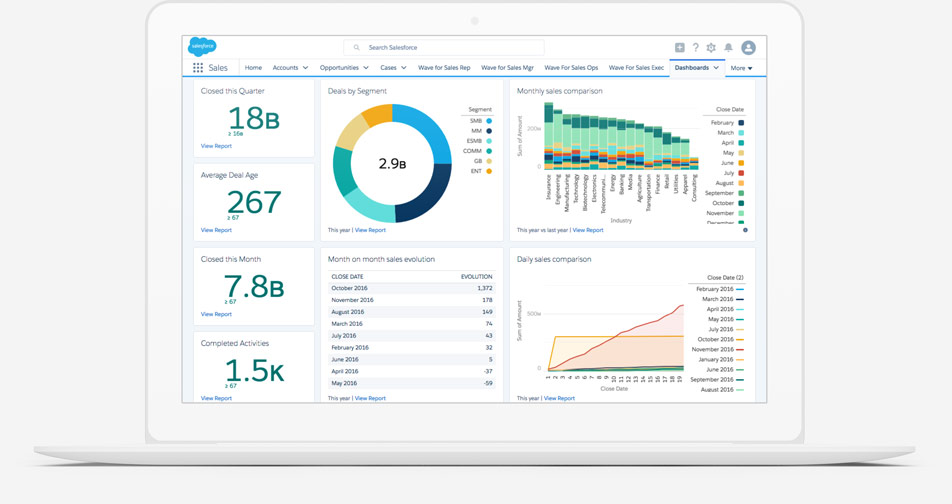
You can see how well your sales staff is doing by looking at the Lead Conversion Rate.
Its formula is the number of leads converted into sales divided by the total number of leads multiplied by 100. It is required to submit a report every month.
The conversion ratio measures how many qualified leads become actual sales in a specific period, divided by the total number of qualified leads generated within that same time frame.
Conversion is a term that must be defined for each firm uniquely. External parties (e.g., investors) will be able to understand the calculations, ensuring that a corporation follows desirable events while external parties are aware of the meaning of the calculations.
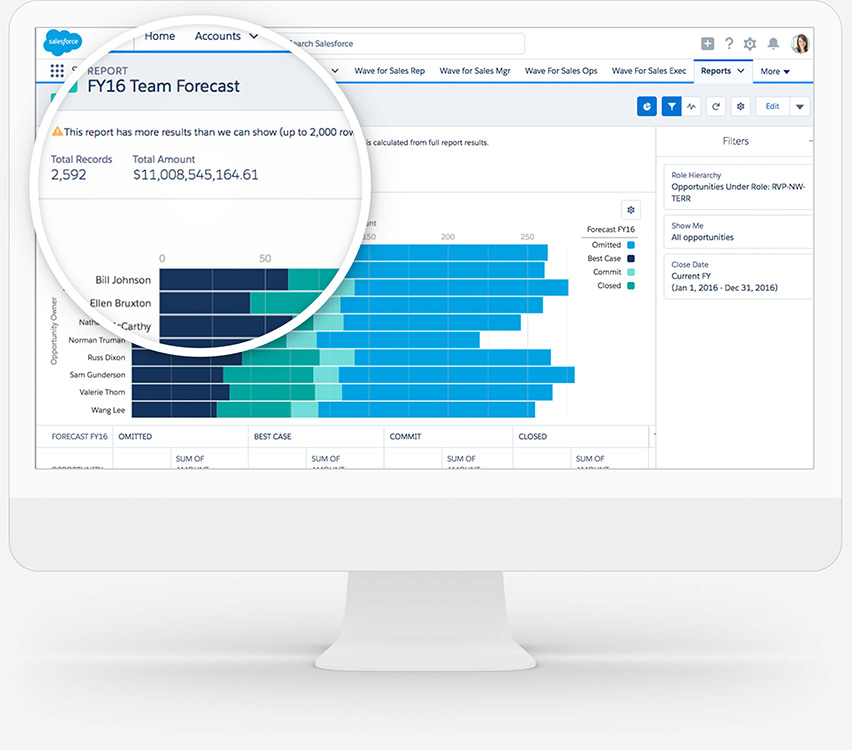
Revenue recognition is the process of accounting for revenue. Revenue is recognized when it is earned, and it is measured by the fair value of the consideration received or to be received.
There are five primary methods of revenue recognition: the cash basis, accrual basis, completion of the contract, percentage of completion, and time-based. Most consulting firms will use the percentage of completion method as it’s the most relevant for their business.
Personally, I like to use that principle to recognize forecasted revenue. You can use those principles to evaluate your sales pipeline and your requirements for new sales.
To be able to “calculate” a forecast on the percentage of completion, I like to calculate my billable hours’ consumption rate. But it’s not perfect. Most consulting services firms have different rhythms for project completion based on each phase.
I generally like to set up a formula that fits our reality with our occupation rate and our starting lag.
Here is an example. I like to set my year in 28 day period (4 weeks). Each billable resource generally consumes 160 hours per period. As a team of 10, we consume 1600 hours per period. We normally have 5 projects happening simultaneously in parallel. So, we can estimate an average of 320 billable hours consumption for one project. (Again, it’s not perfect).
If I sell 2000 hours this month, it will take 6.25 months to complete.
By calculating this way, you can start setting objectives and goals for your team that consider your billable hour needs.
There are two different ways to calculate sales capacity.
One is to define a Sales Capacity for a rep. How much is each sales rep able to generate?
As a consulting/professional services firm, you want to be able to calculate your team capacity in terms of new sales.
In terms of forecasting, you want to be able to have your team capacity for the following weeks/months based on your planning.
Since the Sales cycle can be long, you want to be able to plan the capacity for the following months to define your sales objectives.
To compute a cancellation rate, it’s important to keep that information in your CRM.
I like to have visibility on timing/capacity reasons why a lead or customer decided to cancel their request. It gives us visibility on how many billable hours we could reach if we had more resources.
The challenge arises when a sales team has a service team at low capacity. They will unconsciously reduce their internal pressure to close sales.
For example, I had a rep whom, in 3 years, went from a 25% to 80% disqualification rate. He would over-disqualify for random reasons because he knew we didn’t have the capacity. Unfortunately, our opportunity won rate stayed the same.
As a result, our Lead to Customer ratio went from 35% to 12% over those 3 years.
I monitor Opportunity Won Rate and Disqualification Rate to verify that phenomenon. This is why I like to calculate a “perfect sales rep” formula as well as compare our year to our best historical ratios. It tells me how much money we left on the table.
You only need to know your total number of leads and your entire marketing budget to calculate your cost per lead.
The price-per-lead formula is straightforward. It’s as simple as dividing your marketing budget by the number of new leads. You may calculate your cost per lead (CPL) using this information.
To get an accurate outcome, you must consider the number of leads and the amount of money spent on marketing.
Again, it’s not perfect. As a Marketing department head is often a jack of all trades. It makes more sense to do this when it’s performance marketing (Growth Marketing Department). This is why I like to split Indirect marketing fees and direct marketing fees per paid channel.
For Organic channels, like Youtube and Google (organic), the calculation model is different. 99% of the cost is the cost to create new content and maintain the assets.
I always say that a content/SEO marketing team has no impact on day-to-day leads. They create for the future.
This is why a lot of CEOs invest in Organic/SEO lead generation. Everything that you create will continue to generate leads even if you fire your whole marketing team. It will only slowly decrease due to the lack of maintenance.
To calculate Customer Acquisition Cost (CAC), sales and marketing costs are multiplied by the number of new customers acquired in a given period. One of the essential KPIs for investors is represented by this indicator. Understanding a company’s ability to grow and its profitability are two of the primary purposes of this tool.
Consider the lifetime worth of a customer when calculating CAC (LTV). Return on investment (ROI) can be gauged using these criteria.
This is an important KPI for a business. It gives you the project size that you need to sell to break even.
It doesn’t mean that you shouldn’t accept projects under that size. But it does mean that your team needs to be conscientious of customer value.
There are several ways to measure the performance of your website (or business, for that matter) using KPIs.
Still, the most common method is to look at the number of unique visitors that come to the site each month and the number of unique visitors that return to the site each month.
This KPI is good to follow organic growth/lead generation and brand notoriety. You can use that as a starting point to measure your conversion rate.
A YouTube KPI or metric assesses the success of a video’s social media distribution on YouTube. An effective social media video strategy is built on recognizing the correct variables for generating successful content.
It’s a great KPI to measure your Youtube Channel Growth.
Keeping an eye on your team’s productivity is easy when you use project management metrics. Using resource management KPIs, or Key Performance Indicators, is a great way to achieve this goal quickly.
This involves identifying and allocating the resources needed to finish a project. Effective communication is a critical part of project management, even if not given top emphasis by tiny start-ups.
It’s a good idea to improve your resource management to increase productivity because resource management uses KPIs as concrete benchmarks to help you track your efficiency.
Billable hours are the amount of time spent working on business projects that can be charged to a client according to an agreed-upon hourly rate.
They are a key metric for many businesses, as they directly impact profitability. Billable hours can be used to track employee productivity, project progress, and more.
Scheduled billable hours are to have on how many hours are planned for the following week. It gives you visibility on your billability and revenues for the following period.

Project profitability is a funny thing. Some firms think that the only way to make money is to take on high-dollar initiatives, but that’s not necessarily true.
In fact, some firms may find themselves in hot water if they take on too many of these types of projects without careful consideration.
Why?
Because while a high-dollar initiative might sound like it’s going to be profitable, it might not actually be once all is said and done.
Project profitability is essential for the overall financial health of a business, so it’s important to be mindful of this when taking on new projects.
To ensure profitability, do your research and ensure that the project you’re undertaking has the potential to be lucrative. By doing so, you can help set your firm up for success.
This Index will give you a reality on each project’s profitability. You will be able to define the right project profitability index for your growth and use this KPI as a qualification index for your sales team.
Mainly, you want to find if any project criteria have a higher chance of generating unbillable hours and decreasing your net project value. As an example, in a previous role, our fixed-fee project profitability index was 3 times higher than time-based projects. Our project of over 600 hours had our worst profitability index.
What’s the best method for determining utilization? The basic calculation is straightforward:
The number of billable hours divided by the total number of available hours (x 100).
As a result, a person billing for 32 hours of a 40-hour week would have an 80 percent utilization rate.
It is possible to compute utilization rates in various methods, depending on whether you are interested in pricing, employment, or the health of your organization.
Divide the total of all employee utilization rates by the total number of employees to arrive at your firm’s utilization rate.
Employee and company-level data can be gleaned from the most reliable time monitoring systems. You can consider administrative hours. It’s a better KPI if you take them out as your employees are not responsible for an internal meeting.
Most professional services firms have roles/skills that create roadblocks.
As an example, in software implementation, architects can be in high demand and rare to find. You’d think that the integrator is not putting in a good ratio of billable hours. But this is happening because he’s always waiting for the analysis to start the customization.
By recruiting a new architect, you’ll increase your integrator’s utilization.

Total utilization is a term that indicates the relative volume of hours an employee delivers, regardless of the type of work being done.
It includes all hours worked with the same denominator of available hours. This metric is a good way to measure employees’ workloads and how effectively they are using their time.
However, it’s important to note that total utilization does not take into account the quality of the work being done or the results of the work. Therefore, total utilization should not be used as the sole criterion for assessing employee performance.
My brother is a mechanic. If you ever go to a mechanic shop, you’ll notice how everything is precalculated and each mechanic is evaluated from those cycle times.
Mechanics will get assigned specific tasks based on their previous performance vs. the cycle time. (Sorry, I ❤️ Cycle Time.)
It’s one of the most important KPIs here.
Defining cycle time by the task will help you create recipes to compare, benchmark, improve, and grow your business. We started using cycle time in our marketing department. As a result, we’ve seen a huge improvement in our content production capacities.
You can compare employee performance, increase profitability, set a consistent production, increase customer satisfaction, improve project scoping, and so much more.
The cycle time formula is the key to revealing the speed of delivery. It’s a crucial metric that allows you to measure how long it takes to deliver a service.
It can also be considered part of continuous improvement efforts since it can expose areas of inefficiencies that you and your team can address. It’s also a valuable metric when it comes to measuring productivity and efficiency within a business.
However, cycle time can be a bit of a mystery for some businesses.
The challenge is that cycle time can only be managed at the task level or a fixed-fee project.
Here is a video that explains how we use project and task templates in Klient PSA:
Interested? Try Klient Risk-FreeOn-Time Task Completion Rate is a measure of how often projects are completed on time. The goal is to get a completion rate as near as possible to 100%.
Knowing the On-Time Completion Rate acts as a starting point for improving project efficiency and can be tracked over time.
On-Time Task Completion Rate is a valuable metric for any organization, especially those who want to improve their project management skills.
Again, there is always a challenge in scoping and executing projects.
You want to identify the variance of the project scope vs. actual. It can be useful in fixed-fee projects to know if revisions are required for the initial scope.
For managers to better grasp their team’s capabilities, they need to calculate the capacity of their resources. To calculate the total number of hours worked throughout the measurement period, multiply the number of working days by eight.
Net work hours are calculated by deducting the time set for team meetings. Individual capacity for each resource is determined by subtracting time off for each team member from the total work hours and multiplying the result by availability. Calculate the total number of hours your team can work by adding the individual capacity of each resource.
This is why PSA software can give you that information in real-time.
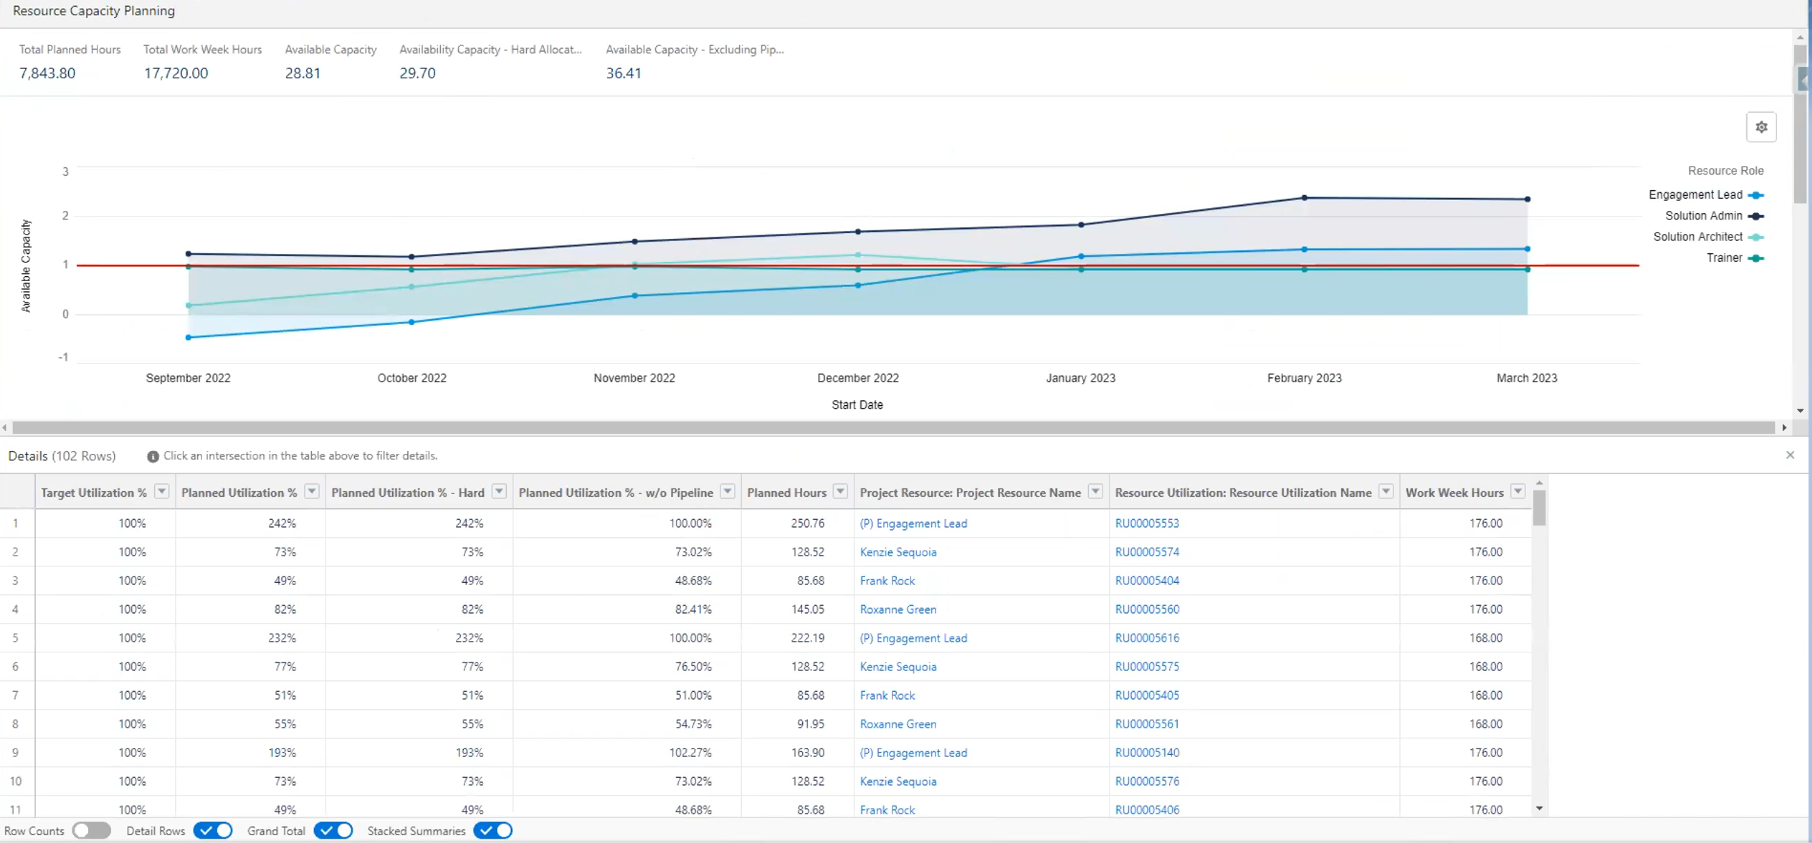
The amount by which your project’s budget exceeds or falls short of your predetermined maximum is known as cost variance.
It’s best to keep an eye on cost and schedule variation, i.e., how early or late you meet project deadlines during your project.
A simple but intriguing KPI to keep track of…
Over time, the Percentage of Tasks Completed keeps tabs on how many jobs each employee has performed.
Although it’s useful to all departments, developers frequently use it to measure productivity.
In comparison to other departments, they may have a higher number of unfinished jobs. After all, they’re constantly juggling a slew of more minor – but no less critical – positions.
This is an excellent indicator for a manager, since it demonstrates how well each department has performed over the past few months. With this indicator, it becomes possible to temporarily provide more resources to one department or delegate some work to employees who are not under as much stress.
The most frequent KPI for assessing a planner’s efficiency is the plan vs. actual (also known as planner accuracy) ratio. It compares the estimated hours of work by the planner and the exact number of hours billed to a job.
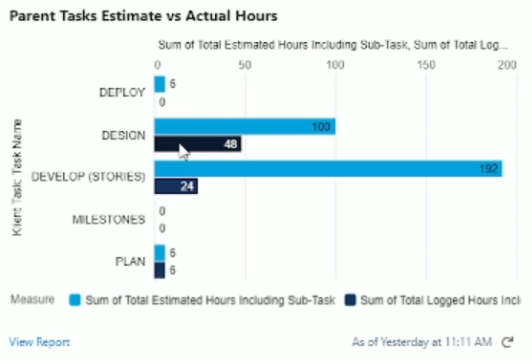
The Schedule Variance percentage tells you how much a project is behind or ahead of schedule in percentage terms.
When calculating schedule variance, use this formula:
A schedule variance percentage (SV%) is calculated by taking the scheduled value and dividing it by the expected value (PV).
This metric is calculated by averaging the story points delivered across the previous sprints. The velocity should be determined across five sprints to obtain a reliable average.
An organization’s overall key performance indicator (KPI) for measuring how satisfied and engaged employees are at any one time is known as employee satisfaction.
The metric combines several minor indications to get an overall picture of how happy and pleased your employees are at work.
If you want to know how your customers feel about your firm, you can use a net promoter score (NPS). It represents the percentage of clients likely to promote your company’s products or services.
Above 0 is good, above 20 is favorable, above 50 is excellent, and above 80 is world-class.
An important KPI for tracking customer retention is the Customer Churn Rate. It can be determined by dividing the number of consumers that stop using a service by the average number of users for a specific period.
Cross-selling and up-selling programs can be measured in a variety of ways, including the following:
One approach to tell if upselling has occurred is to look at the average sales volume for each customer.
The number of items and services available to each customer increases as the company’s sales breadth increases.
You get a better cross-selling ratio when you divide the total number of products or services sold by the total number of customers. Cross-selling and up-selling efforts may have been unsuccessful if customer retention rates are higher than typical.
Customer attrition can be caused by various circumstances, including poor customer service.
Companies use KPIs to measure and track consumer satisfaction with their products, services, and experiences. The ultimate goal is to discover factors influencing customer satisfaction and identify potential growth and enhancement areas.
A few years back, one of my teachers at HEC, Yany Gregoire, talked about the double fault. Customers that complain are normally customers who want to keep working with your business. They only want a solution. By engaging in service recovery, they will most likely become your most loyal customer.
This metric is computed by taking the number of employees who leave and dividing it by the average number of employed people during that time. Assume that six of the ten outgoing employees left of their own volition, based on the data above.
Employee churn in professional services has a huge impact on customer retention. The knowledge transfer is frequently bad and if a customer endures multiple churns in a short period of time, they are most likely to leave the company as well.
To know how happy and engaged your employees are at any given time; you need to assess employee satisfaction.
The metric combines several minor indications to get an overall picture of how happy and pleased your employees are at work.
Using this KPI, you may better understand the approval process and see whether you need to make any adjustments.
This aspect can help improve the communication between the service provider and the client.
Change request affects the scope, cost, and timeline of a project. A large variation from the initial scope can slightly move the project from its initial objectives. Following the 80/20 rule, these projects will end up costing a lot in requests that aren’t essential to the organization.
By monitoring this KPI, you can identify a project/consultant/customer going off-track and verify if those changes are within the project objectives.
KPI for customer service teams is the total number of customers who have submitted a support request.
Keeping tabs on the top line is just the beginning; you’ll also need to look at how the volume changes with the year’s hours, days, and seasons.
Key Performance Indicator (KPI) and Return on Investment (ROI) are acronyms used in Digital Marketing.
Digital marketing uses the phrase “Key Performance Indicators” to describe the marketing measures used to evaluate a digital marketing campaign’s performance.
The ratio of revenue generated per employee is crucial since it approximates the amount of money each employee brings into the business.
To get a company’s revenue per employee, divide the company’s total income by the number of employees it currently has on staff.
In project-based services, billable utilization refers to the percentage of available hours personnel spend earning money. The formula for the usage rate is as follows:
To calculate a company’s billable utilization percentage, multiply the total billing hours by the total available working hours by 100 percent.
For most professional services organizations, the billable utilization rate is a key performance indicator (KPI).
Divide the monthly sales by the entire monthly overhead costs to arrive at the overhead rate.
To determine your overhead rate, multiply this value by 100.
Productivity can be measured by the percentage of billable hours your technicians spend on billable tasks for a customer.
Field service firms frequently monitor this KPI since it is more financially oriented. The most significant component of most KPIs or metrics is what you do with them — in other words, how the KPI drives decision-making.
The percentage of billable hours makes this crystal clear. These technicians are more productive if they have a large portion of their work time being billable hours, while the less effective technicians spend most of their time on non-billable jobs.
Hourly work is invoiced by calculating the hourly rate for each activity and providing a detailed explanation of each performed task.
The hourly invoice keeps track of the time spent on a project and clarifies when it’s time to get paid.
Regarding overall departmental efficiency, measuring costs per invoice handled provides the organization’s first insight.
The infrastructure and follow-up, personnel pay, management overhead, and IT support are only some of the costs associated with processing an invoice.
Using this KPI, you can see how long it takes for customers to complete a purchase order in a shopping cart. It’s based on a year’s worth of data, returning to the prior year.
A total of four measurements can be shown on the app. For each day of the week, there are four price ranges: low, medium, high, and very high (Main Measure).
It shows the average approval time for low, medium, high, and high-cost items. In advance, you need to establish a set of acceptable values.
Using this KPI, you can see how long it takes on average to invoice a given percentage of your line volume.
The invoice fill rate option allows you to set this proportion.
For the average transaction value, multiply the total amount by the number of transactions, equal to how many sales there were during the time in question.
This can be computed on a daily, monthly, or yearly basis.
After subtracting all of your operational expenses, taxes, interest, and depreciation, your net profit is the genuine profit that remains.
The net profit margin is calculated by dividing the total revenue by the entire profit margin.
Total SG&A = Direct selling expenses (Commissions/Selling Fees) + Indirect selling expenses (Marketing/Sales wages + Marketing Budget) + Administrative Expenses (Rent, Utilities, Supplies, Administrative staff wages)
SG&A affects a company’s profitability and break-even point. The point of equilibrium is when revenue and expenses are equal.
It’s one of the most accessible places to find methods to boost profits.
Non-sales staff salaries may usually be cut without hurting production or sales. After a merger or acquisition, SG&A is a top cost-cutting target. It’s an easy target for management teams looking to boost profitability.
Key performance indicators are used to measure the success of a company’s strategic, financial, and operational goals compared to those of other businesses in the same industry.
Among the monetary metrics that can be used are net profit (also known as the bottom line or gross profit margin), revenues less specific costs, and the current ratio (liquidity and cash availability).
Most customer-focused key performance indicators (KPIs) are geared toward improving efficiency, delighting customers, and ensuring they return.
Want to keep your KPIs on track and keep your business running smoothly? Klient PSA helps you run your entire business on one platform! This makes it easier than ever to keep track of every KPI you need to grow your business sustainably.
Try Klient PSA Risk-Free
You liked this Klient Tip? Share it with your team!

Run your entire SaaS and consulting business on a single professional service automation platform native to Salesforce!
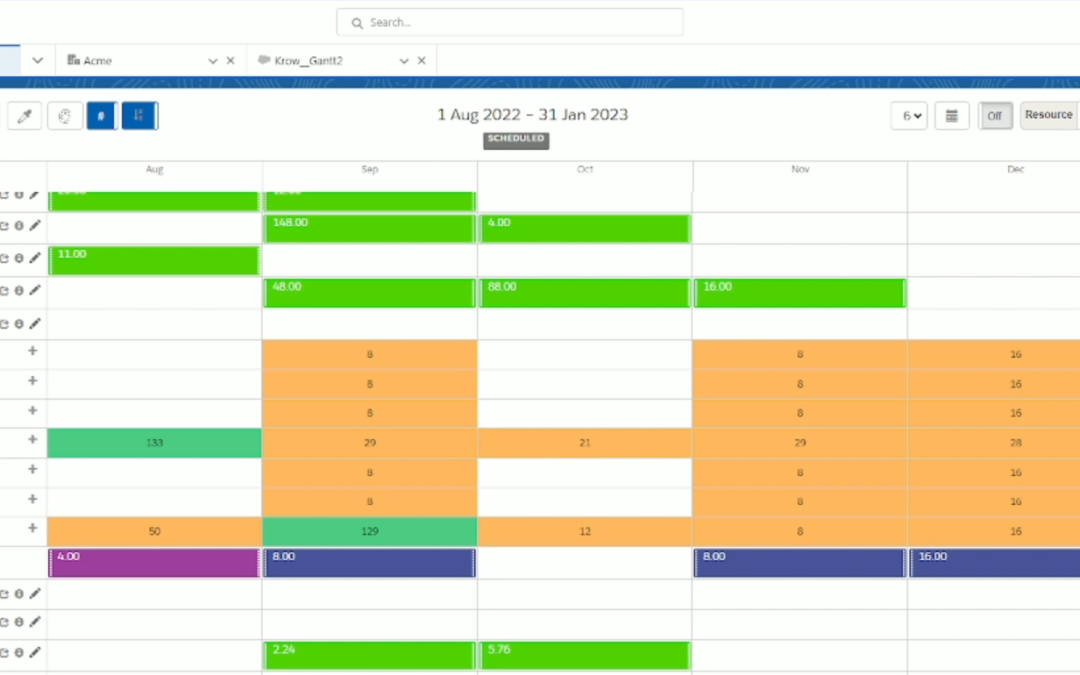
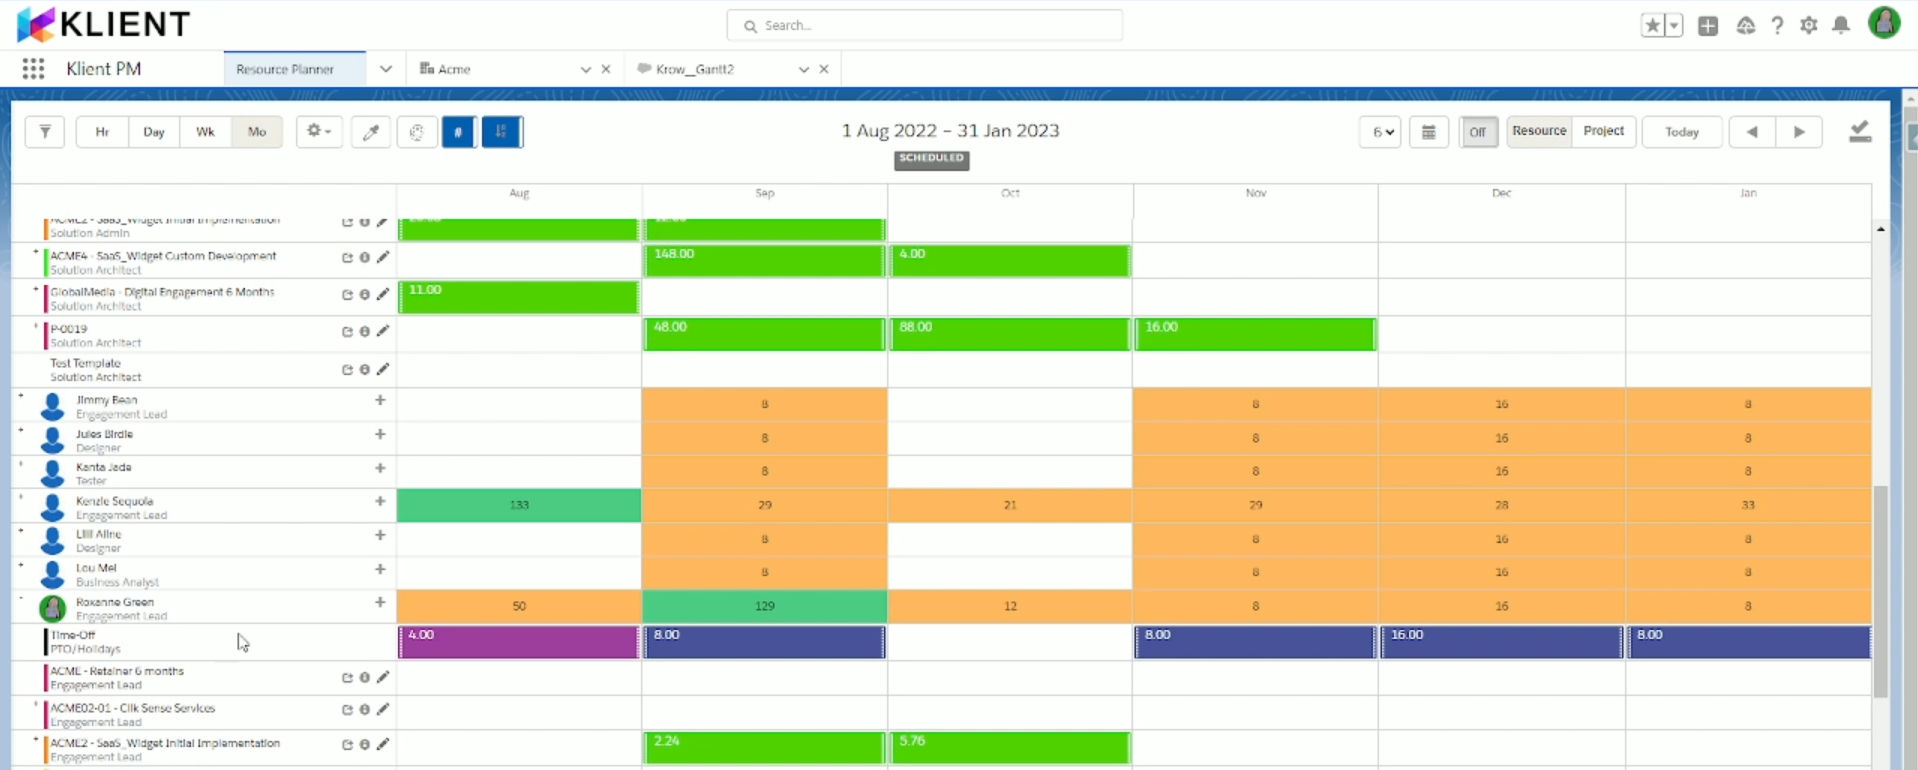
While the primary goal of PMs is to ensure each project is executed as efficiently as possible to save costs, they also have to consider proper management of company assets and work-life balance for employees. Human workers are the company’s greatest resource, and their well-being should be a priority. This is where resource leveling and resource smoothing become handy. These two strategies enable PMs to look at their project plans and pinpoint problematic areas, like days when people are overworking or unrealistic deadlines given the available resources.
In this article, we’ll walk you through resource smoothing vs. resource leveling, their advantages/disadvantages, and the situations where these methods work best.
First, it’s important to understand the process of resource management, which involves planning, scheduling, and allocating people, technology, and money to a project. Resource management is crucial because it helps PMs prepare an inventory of existing resources, pinpoint gaps or missing information, and prioritize allocation based on the needs of different projects.
This process has three main components: resource allocation, resource leveling, and resource smoothing. The first step is resource allocation, where team members are assigned specific tasks based on their strengths and expertise. This is the planning stage, where resources are strategically placed to optimize the timeline.
However, projects might encounter resource and time constraints for various reasons. Resource leveling or smoothing is a method for anticipating these challenges and applying the right solutions and adjustments.
Here is a quick video on how resource management can work in a Professional Services Automation or Project Management Software.
Based on the Project Management Body of Knowledge (PMBOK) Guide, resource leveling helps PMs evenly allocate resources by adjusting a project’s start and completion dates. This strategy ensures that no one is overworking, the equipment is available, and requirements are made clear so that there are no additional costs to the project.
Leveling works best when there are limited resources and the PMs want resource usage at a constant level. That’s why this technique is sometimes referred to as resource constrained scheduling (RCS).
There are several factors that will help PMs apply resource leveling effectively. First is knowing the dependencies or the relationships between tasks. For example, which activities must be completed before the team can move on to the next? Another factor to consider is the resource conflict. What is the main issue that needs to be solved? Is it human resources, equipment, or technology?
Finally, it is also important to look at the different types of constraints. Is it mandatory (physical limitations like lack of equipment), discretionary (team members’ preferences or actions), or external (third-party challenges)? Only after figuring out these factors can PMs create a resource leveling plan that adequately addresses the pressing concerns of the project.
According to Online PM Courses, here are some of the things PMs can do during resource leveling:
In addition, there are also specific instances where resource leveling can be used:
Basically, resource leveling answers this question: Given the resources you have, when will you be able to complete the project?
Aside from re-balancing resources, leveling can offer several advantages:
However, there might also be disadvantages to this technique, mainly because something has to be sacrificed, whether cost, scope, or time.
Suppose a project is planned to be completed in two days. It has three activities (A, B, and C), and each activity takes 8 hours to complete.
Activities A and B can be done by one employee (Alex) and C by another (Jane).
At first, it would seem like A and B could be performed at the same time by Alex. However, it would take Alex 16 hours to complete both activities. This situation would lead to him being overworked on the first day.
To address this, the PM decides to extend the project to three days instead of two. Activity B is then moved to Day 2 to give Alex enough time to finish each task and evenly allocate working hours.
Now that we’ve discussed the basics of resource leveling, let’s look at the different methods or techniques that PMs can use, depending on the urgency of the situation. There are three main methods: critical path analysis, fast tracking, and crashing.
Critical path analysis (CPA). This most common technique comprises mapping out every critical task needed to finish a project. This process includes identifying how long it would take to complete each task and the other tasks dependent on each other. CPA is a good tool to ensure that deadlines are realistic.
The first step in CPA is to define all project tasks (both critical and non-critical), and the maximum and minimum times it would take to complete these tasks. It’s also important to include slack time (or float) in the calculation to come up with a reasonable deadline.
A timeline is then created to track each task using Gantt and bar charts. CPA is often used in industries that have complicated processes. However, most CPAs are now automated using resource management software.
Fast-tracking. This resource leveling technique compresses schedules so that some tasks are completed simultaneously instead of sequentially. For example, if certain activities are not dependent on each other, they can be done on the same day. This method is particularly helpful if there is simply not enough time.
One example of this technique is creating different prototypes before a design has been approved. However, while this can save some time in the beginning, it does have the risk of being reworked if there are mistakes or massive changes to the design.
Crashing. This method is often considered the last resort, particularly if fast tracking is still insufficient. The idea behind crashing is to shorten the project duration by adding more resources (e.g., labor and equipment) with the least possible cost, including hiring extra staff or paying a premium to acquire a service faster.
This technique can become expensive real quick, so it’s best to use it when there are no other options available or when a project can no longer afford to miss its deadline.
| Resource Leveling | Resource Smoothing |
| The finish dates of the project can change | The finish dates of the product stay the same. |
| Critical paths change, mostly increasing. | You can pause activities within its float boundaries. |
| Scheduling when resources are under or over-allocated. | Scheduling is based when resources are unevenly allocated. |
| The main constraint is your resources. | The main constraint is your project end date. |
| Resource leveling can be implemented for tasks on the critical path. | With resource smoothing, you don’t alter the critical path. |
| Resource leveling is usually scheduled first. | Resource smoothing is often performed after resource leveling. |
We’ve discussed resource leveling and when to use it, let’s now look at the other resource optimization technique: resource smoothing. Some people might be confused about when to use resource leveling versus smoothing because they have very subtle differences.
Resource smoothing is used to balance the peaks and troughs of individual tasks after they have been leveled or re-allocated. Whereas resource leveling deals with the question of resource constraints, smoothing deals with time constraints (which is why it is also known as time constrained scheduling (TCS)).
Here are some instances where resource smoothing works best:
While often done at the last stages of the project, resource smoothing is a good tool to keep everyone on track. This method is particularly crucial since the project can no longer afford any delays at this point, particularly for critical activities.
Advantages:
Disadvantages
Example scenario of resource smoothing:
A project must be completed within three days and is once again assigned to Alex and Jane. They can both work on the project simultaneously, without any activity dependencies. The PM notices that on Day 1 and Day 2, Jane is working 10 hours while Alex is working for only 6 hours.
The PM then re-arranges the tasks on Days 1 and 2 so that they’re evenly distributed (as much as possible) between Alex and Jane. This strategy would ensure that both employees are not overburdened and can maintain the quality of their output to finish the project on time (Day 3).
The important thing to remember on resource optimization is to understand the main challenge the project is facing. Sometimes, these two techniques are done simultaneously to ensure that issues are being addressed in a timely manner. Like everything around project management, there is a time for flexibility and a time to stick to the plan.
If you want a resource management tool that’s automated, flexible, and highly customizable, Klient can build one to tailor it to the needs of your business. We can help you take control and manage staffing, and allocate tasks appropriately and intuitively.
We’d love to help you out. Schedule a demo with us.

You liked this Klient Tip? Share it with your team!

Run your entire SaaS and consulting business on a single professional service automation platform native to Salesforce!
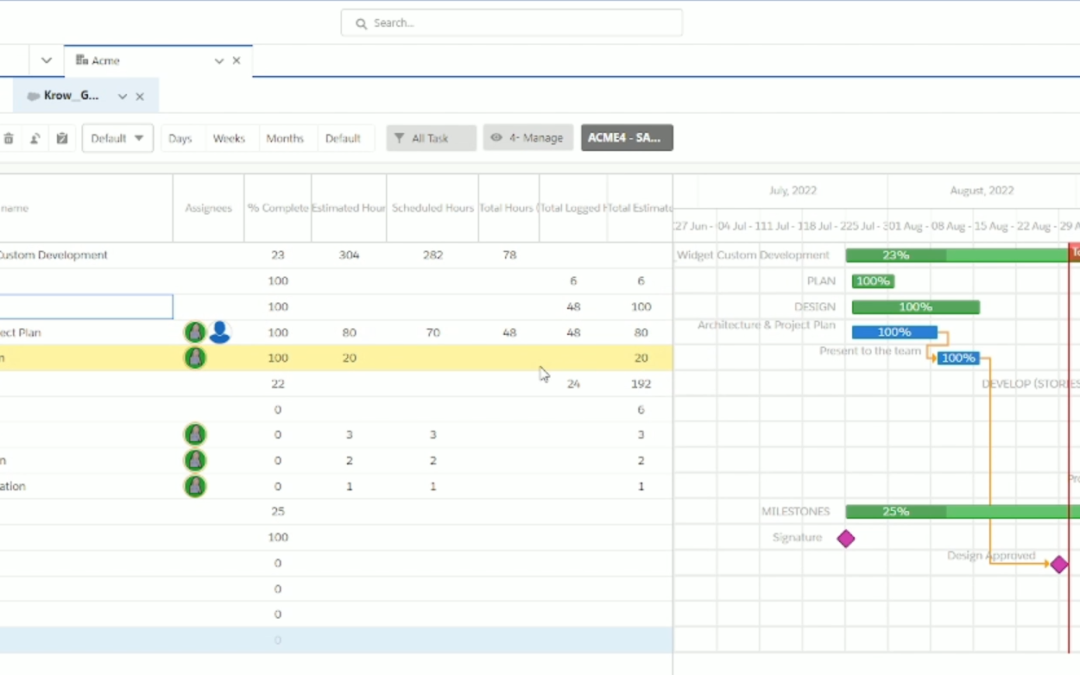
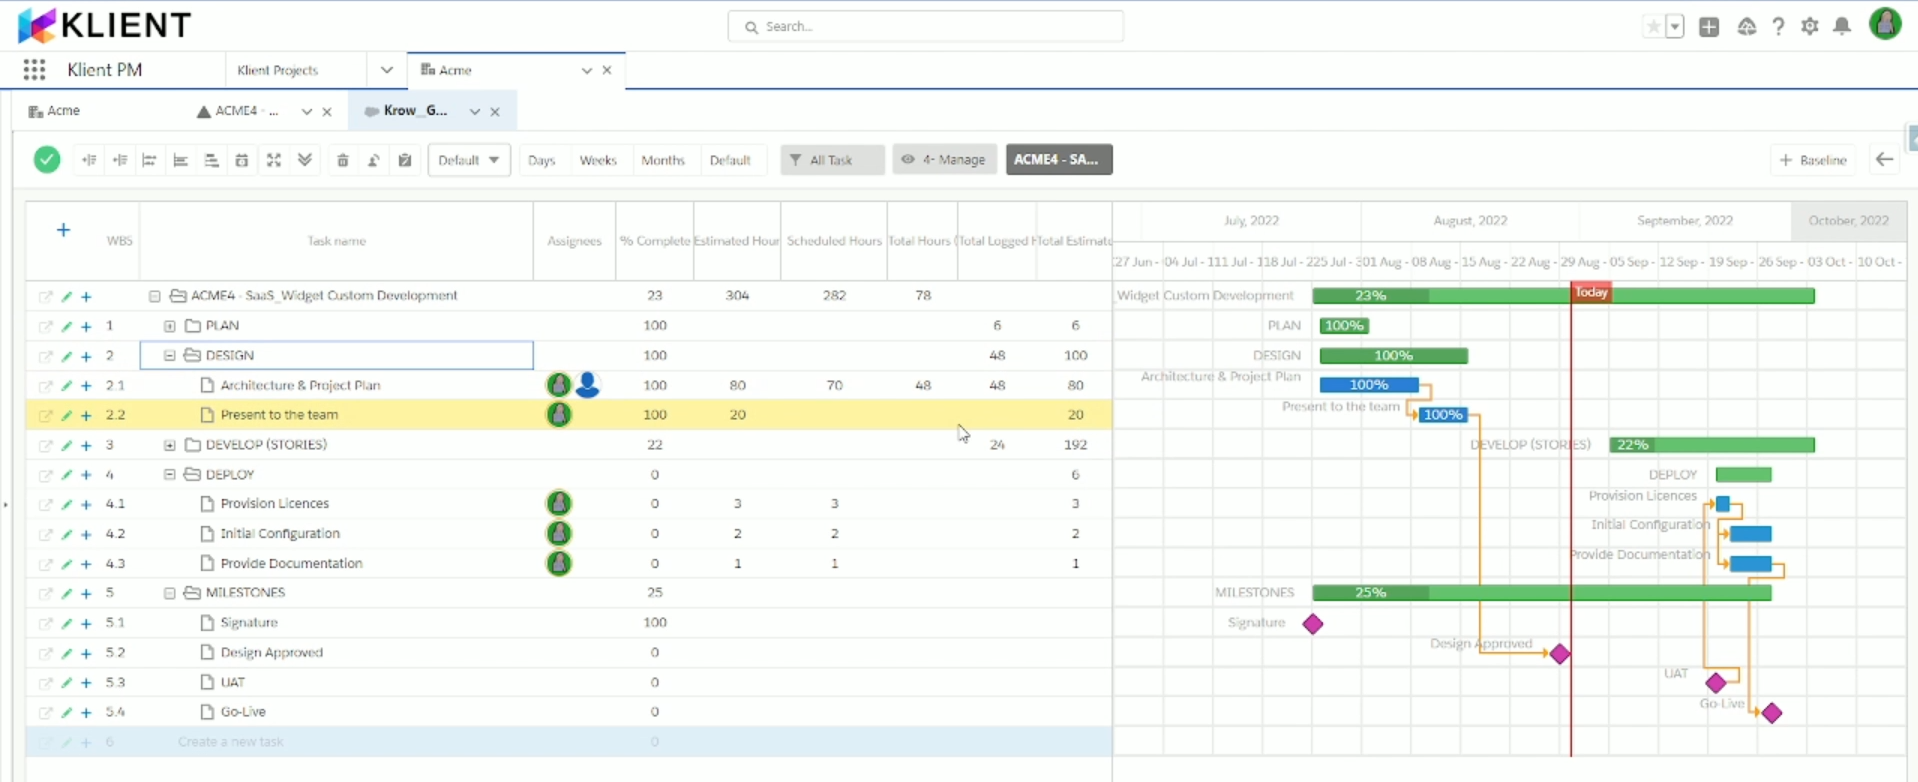
However, with resource histogram project management, project managers (PMs) don’t have to panic. That’s because resource histograms tell them exactly where the budget is going daily and where they might tweak things to get the project back on track.
Resource histograms are just one way PMs can streamline processes and protect themselves from unexpected situations. Fortunately, companies seem to be catching up to the importance of being prepared. According to the Project Management Institute (PMI), wasted funding due to poor project management (e.g., budget overshoots, scope creep, and missed deadlines) has declined to 9.4 percent in 2021 compared with 11.4 percent in 2020.
With that being said, they’re just one of several tools you can leverage to manage your resources.
In this overview, we’ll walk you through your burning questions about resource histograms, how to build and implement one, and what other tools you can use effectively track and manage every source for any project.
Get A Risk-Free Trial Of Klient PSA
A resource histogram is a visualization and statistical tool used to manage resources. Typically, a simple table might give you an idea of how you monitor your resources daily, but it’s hard to visualize information that way.
(Also, let’s face it, tables can be boring).
By turning your tables into resource histograms, you can easily see at a glance how well you’re keeping everything on track. You can also find out if daily costs are exceeding the budget.
You might have guessed it, but the first step to build a histogram is to establish the resource cutoff per day. Without this clarity, it can be very easy to overshoot spending or over-allocate your resources.
Next is creating a “table of dependencies,” where you record details like types of activities, how long these activities will take, and how much they will cost per day. From this information, you can create a simple Gantt chart to visualize the data.
Most people stop at this part. But if you take a step further and create a histogram, then you can have a better guide on when to move resources around or when to delay the due dates. We highly recommend two great videos from Engineer4Free that explain this concept really well. But, don’t worry, we’ll also break everything down in the rest of this article.
However, to give you a better context, we will explain the concept further with some nuance.
Aside from getting a cool visualization tool, resource histograms give you detailed information on the progress of your projects.
In particular, some tasks are too complex and have many components; without a resource histogram, it’s like getting lost in a maze. You can have multiple activities/resources that overlap on a project.
This is where the resource histogram comes in. As a project manager, you can map out your resources on a resource histogram to make sure everything is correctly allocated.
Once you have your histogram, you can measure resource utilization and make sure you’re neither underutilized nor overextended.
A project manager can use a resource histogram at any point in a project. It can be a handy tool, even if it takes time and effort to create one in Excel. (It can even be manually created on paper, although this takes longer and is prone to errors.)
The resource histogram can help project managers figure out how profitable a particular activity is and which activities are interdependent. They can also monitor different processes and make data-based decisions.
For example, they can determine which part of the project might benefit from added resources or have been over-allocated for quite some time.
Below are other examples of when a resource histogram is most beneficial.
To demonstrate this, let’s say we have five parent tasks for the whole project.
| Task | Predecessor | Duration | Start Day | End Day | Cost / Day |
| Analysis | – | 2 | 0 | 2 | 1560 |
| Architecture | Analysis | 3 | 3 | 5 | 1680 |
| Configuration | Architecture | 3 | 6 | 8 | 1680 |
| Implementation | Architecture | 2 | 6 | 7 | 1520 |
| Training | Implementation | 3 | 7 | 10 | 1400 |
In the table of dependencies below, you can see that each task/role is clearly specified per day, along with their corresponding budgets. Being detailed as much as possible helps to create relevant and accurate histograms.
| Day | Task | Total Daily Cost |
| 1 | Analysis | 1560 |
| 2 | Analysis | 1560 |
| 3 | Architecture | 1680 |
| 4 | Architecture | 1680 |
| 5 | Architecture | 1680 |
| 6 | Configuration + Implementation | 3200 |
| 7 | Configuration + Implementation | 3200 |
| 8 | Configuration + Training | 3080 |
| 9 | Training | 1400 |
| 10 | Training | 1400 |
This kind of table is simple to create on the fly. However, it’s a nightmare for a 6-month project. This is the kind of report that PSA software can generate quickly.
While resource histograms are very useful, they also have certain limitations. For one, it feels outdated and should have been automated long ago. But resource histograms do serve a purpose, and PMs continue to benefit from this simple but informational tool.
Pros:
Cons:
Resource histograms enable PMs to do two main strategies: resource leveling and resource smoothing.
Let’s go over each of these terms to clarify why a resource histogram can come in handy.
Let’s say you discovered through your resource histogram that there are three days when the project exceeds the daily budget or time limit. You can then re-shuffle major activities to move some tasks to the days below the resource limits, which levels the playing field and avoids strains on your team.
Resource leveling basically ensures that resources are spread evenly throughout all projects for a given customer. Here are some examples of when to apply this technique.
Here are more concrete situations where resource leveling works best:
Let’s say a user interface (UI) developer team is refreshing an e-commerce website for re-launch within the week.
However, a bug fix has been delayed for a couple of days. Since it is very critical to ensure that all bugs have been fixed beforehand, the PM can choose to extend the deadline to the following week.
To make up for the lost time, the PM can maybe tweak the due dates of some minor tasks.
A large project is due to start by next week, but the requirements/specifications from the customer are still not complete.
The PM communicates to the customer that since they don’t have all the needed information yet and that they will have to start a few days later. The PM then gives the customer choices on how they want to reallocate resources to compensate for the lost time caused by the customer’s delay.
Imagine if a team of software engineers got sick at the same time. A project needs to be delivered to the customer by next week.
The PM can then reallocate some of the engineers from the other projects that are not due yet to help out in the meantime.
Resource smoothing is usually done after resource leveling. In leveling, the primary constraint is resources; in smoothing, it’s time or schedule. After everything has been reallocated, a project manager may notice that there are still some workdays that exceed the limit within the new plan. The PM can then reallocate tasks and teams without major re-shuffles, particularly in critical activities.
Learn more: Resource smoothing and leveling
Smoothing ensures that things are going according to plan and that the project won’t have any more significant shifts or scope creep. Here are some examples of when to use resource smoothing.
To better visualize how this technique works, here are some sample situations where resource smoothing works best.
First of all, it’s much simpler to use project management software or PSA software to manage a resource histogram. But if you’re still using Excel for those reports, it’s relatively easy to set up.
Now that we’ve gone through the background and essential characteristics of resource histograms, let’s look at how we can build them. We’ll start with a relatively simple example.
First, we need to create a table of dependencies on Microsoft Excel. For example, the table below shows the number of employees required per month.

Next, select the entire table, including the titles and headings, and click the Insert tab. Under Column, select the Stacked Column in 3-D (under 3-D Column). (You can also choose the 2-D version, but in general, stacked columns work best).

Our table of dependencies should be transformed into this:

As you can see from this basic resource histogram, you can include or change additional information, like extending the months or adding more roles/employees.
This way, PMs can immediately see the months where employees would be needed more (e.g., July-September on the sample histogram). The team can then prepare in advance for these periods, including hiring additional staff if required.
Another way to read this histogram is if there’s an employee limit. For example, let’s say the customer only wants to pay for 10 employees max for this project.
By referring to the histogram, PMs can choose to shuffle specific tasks so that they are performed in the first quarter or last quarter of the year, where resource allocation is much lower.
Resource histograms can be simple to create but can give valuable detail. It all depends on how PMs want to use and adjust them to the project’s needs.
Despite their use, resource histograms do have their limitations. When you have complex projects with several moving parts, you’ll need a more robust tool to allocate and manage resources and maximize utilization.
You can leverage several types of views for every project in your pipeline and easily figure out in a single glance:
In this video, watch how a Professional Services Automation (PSA) tool replaces a Resource Histogram with little to no effort:
You don’t need to be an Excel wiz to do this kind of report. This is why a solution like Klient can help you out!
If you want a resource management tool that’s automated, flexible, and highly customizable, Klient can build one that’s tailored specifically for your business. We can help you take control and manage staffing, and allocate tasks appropriately and intuitively.
The best part? You can try Klient risk-free! Click below to request your free trial of Klient PSA:

You liked this Klient Tip? Share it with your team!

Run your entire SaaS and consulting business on a single professional service automation platform native to Salesforce!

Congratulations to the Tropos team for their graduation from Klient University, LIVE on Klient psa within just a few weeks, very well done!!