I’ve worked for 4 years in professional services within the management committee and many more in the software industry. From this experience, I wrote a list of all my favorite professional services KPIs I would use as part of a Professional Services Firms management committee.
In Gino Wickman’s book, Traction®, there is a theory that each manager should own a number – in other words, a KPI.
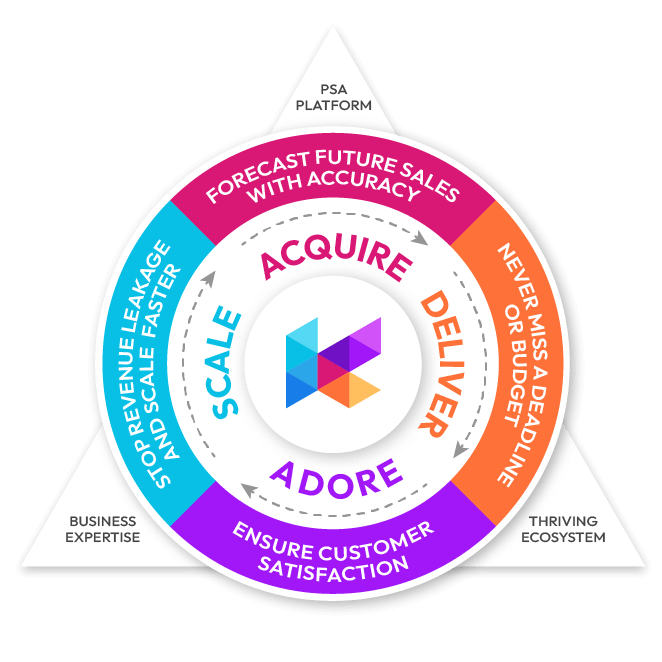
Below is a great list to find the KPI that you want to grow in your professional services firm. If you run a consulting or advisory firm, these map straight to utilization and margin. I’ve split the list into 4 categories:
- Acquire
- Delivery
- Adore
- Scale
The KPIs come from various sources, my own experience in the industry, and the 2022 Professional Services Maturity™ Benchmark by Service Performance Insight.
And I’ll be using a few examples from our software, Klient PSA, to illustrate.
Enjoy 🙂
Acquire: The top 10 professional services KPIs for sales and marketing management
Customer acquisition can be a tricky business. You want to attract new customers, but you don’t want to give away too much in terms of marketing and sales incentives.
After all, you want them to buy from you because they see the value in what you’re offering, not because you’re offering a deep discount.
Lead generation is often the first step in the customer acquisition process. By generating leads – potential customers who have expressed an interest in your service – you can start to build a relationship with them and eventually persuade them to buy from you.
1. Sales Growth Rate:
- Formula: ((Current Period Sales — Prior Period Sales) / Prior Period Sales) x 100
- Department: Sales
- Frequency: Annually/Monthly/Quarterly
- Goal: Am I growing?
- Rating: ⭐⭐
Keep track of your sales. To get a percentage, divide (current earnings – previous earnings) by previous earnings, then multiply by 100. Sales growth is measured annually, but you can measure it monthly or quarterly.
Relevant revenue growth is unaffected by monthly seasonal swings. Organizations with seasonal revenue should measure sales increase in the same month (or season) as the previous year.
2. Lead to Opportunity Ratio
- Formula: (Number of leads converted into opportunities / total number of leads) x 100
- Department: Sales/Marketing
- Frequency: Monthly
- Limitation: Sales Cycle Length
- Goal: Do I get the right leads? Do I qualify correctly?
- Rating: ⭐⭐⭐
You can see how well your sales staff is doing by looking at the Lead Conversion Rate.
Its formula is the number of leads converted into sales divided by the total number of leads multiplied by 100. It is required to submit a report every month.
3. Lead to Customer Ratio
- Formula: (Number of leads converted into customers / total number of leads) x 100
- Department: Sales/Marketing
- Frequency: Monthly
- Limitation: Sales Cycle Length
- Goal: Am I good at winning new customers?
- Rating: ⭐⭐⭐⭐⭐
The conversion ratio measures how many qualified leads become actual sales in a specific period, divided by the total number of qualified leads generated within that same time frame.
Conversion is a term that must be defined for each firm uniquely. External parties (e.g., investors) will be able to understand the calculations, ensuring that a corporation follows desirable events while external parties are aware of the meaning of the calculations.
4. Forecasted revenue recognition
- Formula: (Total Billable Hours Sold for a Period / Avg. Billable Hours Consumption per period)
- Department: Sales/Operations
- Frequency: Monthly
- Limitation: Formula/Unprecise
- Goal: How much revenue I’ll generate from my new sales for the following period?
- Rating: ⭐⭐
Revenue recognition is the process of accounting for revenue. Revenue is recognized when it is earned, and it is measured by the fair value of the consideration received or to be received.
There are five primary methods of revenue recognition: the cash basis, accrual basis, completion of the contract, percentage of completion, and time-based. Most consulting firms will use the percentage of completion method as it’s the most relevant for their business.
Personally, I like to use that principle to recognize forecasted revenue. You can use those principles to evaluate your sales pipeline and your requirements for new sales.
To be able to “calculate” a forecast on the percentage of completion, I like to calculate my billable hours’ consumption rate. But it’s not perfect. Most consulting services firms have different rhythms for project completion based on each phase.
I generally like to set up a formula that fits our reality with our occupation rate and our starting lag.
Here is an example. I like to set my year in 28 day period (4 weeks). Each billable resource generally consumes 160 hours per period. As a team of 10, we consume 1600 hours per period. We normally have 5 projects happening simultaneously in parallel. So, we can estimate an average of 320 billable hours consumption for one project. (Again, it’s not perfect).
If I sell 2000 hours this month, it will take 6.25 months to complete.
By calculating this way, you can start setting objectives and goals for your team that consider your billable hour needs.
5. Sales Capacity by Employee/Skills/Roles Utilization
- Formula: Team’s Total Capacity – Number of Planned Hours
- Variance: Project Manager’s Total Capacity – Number of Planned Hours for Project Manager
- Department: Sales/Operations
- Frequency: Monthly/Quarterly
- Limitation: Formula
- Goal: How much can my sales team sell for the following period?
- Rating: ⭐⭐⭐
There are two different ways to calculate sales capacity.
One is to define a Sales Capacity for a rep. How much is each sales rep able to generate?
As a consulting/professional services firm, you want to be able to calculate your team capacity in terms of new sales.
In terms of forecasting, you want to be able to have your team capacity for the following weeks/months based on your planning.
Since the Sales cycle can be long, you want to be able to plan the capacity for the following months to define your sales objectives.
6. Number of canceled sales/projects/requests
- Formulas
- Ratio: # of Sales Lost/Disqualified due to Capacity / Total # of Leads
- Amount: # of Sales Lost/Disqualified due to Capacity x Values
- Perfect Salesmen Formula: # of Leads x Our Best Lead to Won Opportunities Ratio x Avg. Won Opportunities Values
- Department: Sales
- Frequency: Monthly/Quarterly/Yearly
- Goal: Is my sales team affected by our capacity?
- Rating: ⭐
To compute a cancellation rate, it’s important to keep that information in your CRM.
I like to have visibility on timing/capacity reasons why a lead or customer decided to cancel their request. It gives us visibility on how many billable hours we could reach if we had more resources.
The challenge arises when a sales team has a service team at low capacity. They will unconsciously reduce their internal pressure to close sales.
For example, I had a rep whom, in 3 years, went from a 25% to 80% disqualification rate. He would over-disqualify for random reasons because he knew we didn’t have the capacity. Unfortunately, our opportunity won rate stayed the same.
As a result, our Lead to Customer ratio went from 35% to 12% over those 3 years.
I monitor Opportunity Won Rate and Disqualification Rate to verify that phenomenon. This is why I like to calculate a “perfect sales rep” formula as well as compare our year to our best historical ratios. It tells me how much money we left on the table.
7. Cost per Lead/Opportunity/Customers (per channel)
- Bad Formulas (If your marketer calculates that way, fire him. No, don’t do it. It’s a “joke”.)
- Marketing Budget / # of LeadsMarketing Budget # of Leads
- Good Formulas
- Paid Channel: Direct Marketing Fees (CPC/CPL) + Indirect Marketing Fees / # of Leads
- Organic Search: Net New Content Indirect Marketing Fees / Net New Organic Leads
- Department: Marketing
- Frequency: Monthly/Quarterly/Yearly
- Goal: Manage your investment in marketing by Channel
- Rating: ⭐⭐
You only need to know your total number of leads and your entire marketing budget to calculate your cost per lead.
The price-per-lead formula is straightforward. It’s as simple as dividing your marketing budget by the number of new leads. You may calculate your cost per lead (CPL) using this information.
To get an accurate outcome, you must consider the number of leads and the amount of money spent on marketing.
Again, it’s not perfect. As a Marketing department head is often a jack of all trades. It makes more sense to do this when it’s performance marketing (Growth Marketing Department). This is why I like to split Indirect marketing fees and direct marketing fees per paid channel.
- Direct Marketing Fees are the CPC bid that you might pay to a platform like Google.
- Indirect Marketing Fees are the time and assets required to create and maintain that campaign.
For Organic channels, like Youtube and Google (organic), the calculation model is different. 99% of the cost is the cost to create new content and maintain the assets.
I always say that a content/SEO marketing team has no impact on day-to-day leads. They create for the future.
- New Net Content Indirect Marketing Fees: Cost per New Blog + Time for Integration + Cost if I need new Assets for Conversions.
This is why a lot of CEOs invest in Organic/SEO lead generation. Everything that you create will continue to generate leads even if you fire your whole marketing team. It will only slowly decrease due to the lack of maintenance.
8. Customer Acquisition Cost
- Formulas: Sales/Marketing Indirect/Direct Costs x Number of new customers
- Department: Sales/Marketing/Operations
- Frequency: Monthly/Quarterly/Yearly
- Goal: Self-explanatory
- Rating: ⭐⭐⭐⭐⭐
To calculate Customer Acquisition Cost (CAC), sales and marketing costs are multiplied by the number of new customers acquired in a given period. One of the essential KPIs for investors is represented by this indicator. Understanding a company’s ability to grow and its profitability are two of the primary purposes of this tool.
Consider the lifetime worth of a customer when calculating CAC (LTV). Return on investment (ROI) can be gauged using these criteria.
This is an important KPI for a business. It gives you the project size that you need to sell to break even.
It doesn’t mean that you shouldn’t accept projects under that size. But it does mean that your team needs to be conscientious of customer value.
9. Website visits
- Formulas: Google Analytics = Total Number of Users
- Department: Marketing
- Frequency: Monthly/Quarterly/Yearly
- Goal: Is my Website content growing?
- Rating: ⭐⭐
There are several ways to measure the performance of your website (or business, for that matter) using KPIs.
Still, the most common method is to look at the number of unique visitors that come to the site each month and the number of unique visitors that return to the site each month.
This KPI is good to follow organic growth/lead generation and brand notoriety. You can use that as a starting point to measure your conversion rate.
10. YouTube subscribers
- Formulas: Youtube Monthly Net New Subscribers
- Department: Marketing
- Frequency: Monthly/Quarterly/Yearly
- Goal: Is my Youtube Channel growing?
- Rating: ⭐
A YouTube KPI or metric assesses the success of a video’s social media distribution on YouTube. An effective social media video strategy is built on recognizing the correct variables for generating successful content.
It’s a great KPI to measure your Youtube Channel Growth.
Delivery: 14 Professional Services KPIs For Project and Resources Management
Keeping an eye on your team’s productivity is easy when you use project management metrics. Using resource management KPIs, or Key Performance Indicators, is a great way to achieve this goal quickly.
This involves identifying and allocating the resources needed to finish a project. Effective communication is a critical part of project management, even if not given top emphasis by tiny start-ups.
It’s a good idea to improve your resource management to increase productivity because resource management uses KPIs as concrete benchmarks to help you track your efficiency.
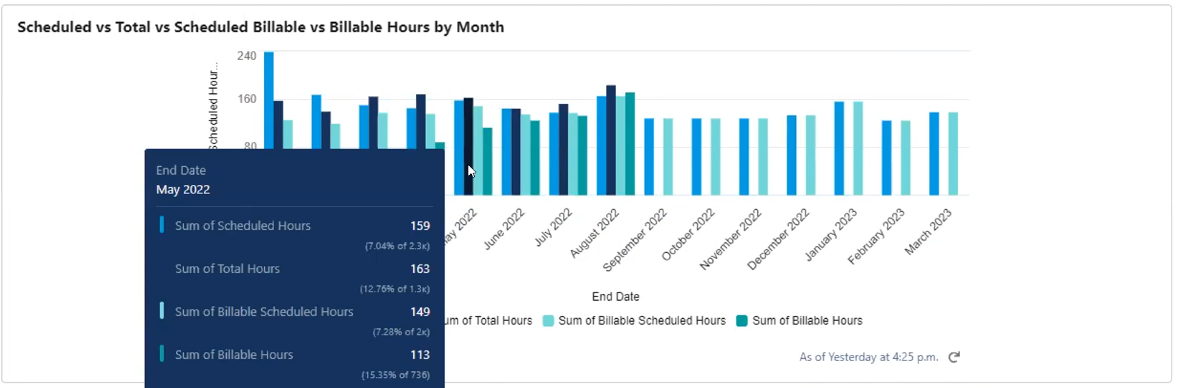
11. Scheduled/Planned Billable Hours
- Formula: Billable Hours assigned to all your resources for the following period
- Department: Operations
- Frequency: Weekly/Bi-Weekly/Monthly (Fit with your Resource Planning Meeting)
- Rating: ⭐⭐⭐
Billable hours are the amount of time spent working on business projects that can be charged to a client according to an agreed-upon hourly rate.
They are a key metric for many businesses, as they directly impact profitability. Billable hours can be used to track employee productivity, project progress, and more.
Scheduled billable hours are to have on how many hours are planned for the following week. It gives you visibility on your billability and revenues for the following period.
12. Project profitability
- Formula: Profitability Index = (Net Project value + (CAC + Administrative Cost split by projects)) / (CAC + Administrative Cost split by Project).
- Net Project Value = Project Revenues – Cost
- Department: Operations
- Frequency: Annually
- Goal: Find your sweet spot in terms of effectiveness and profitability.
- Rating: ⭐⭐⭐
Project profitability is a funny thing. Some firms think that the only way to make money is to take on high-dollar initiatives, but that’s not necessarily true.
In fact, some firms may find themselves in hot water if they take on too many of these types of projects without careful consideration.
Why?
Because while a high-dollar initiative might sound like it’s going to be profitable, it might not actually be once all is said and done.
Project profitability is essential for the overall financial health of a business, so it’s important to be mindful of this when taking on new projects.
To ensure profitability, do your research and ensure that the project you’re undertaking has the potential to be lucrative. By doing so, you can help set your firm up for success.
This Index will give you a reality on each project’s profitability. You will be able to define the right project profitability index for your growth and use this KPI as a qualification index for your sales team.
Mainly, you want to find if any project criteria have a higher chance of generating unbillable hours and decreasing your net project value. As an example, in a previous role, our fixed-fee project profitability index was 3 times higher than time-based projects. Our project of over 600 hours had our worst profitability index.
13. Employee/skills/roles utilization
- Formula: # of billable hours / total schedulable hours (by employee/skills/roles)
- Department: Operations
- Frequency: Monthly/Quarterly/Annually
- Goal: Try to find if any employee, skills, or roles is underutilized or overutilized.
- Rating: ⭐⭐⭐
What’s the best method for determining utilization? The basic calculation is straightforward:
The number of billable hours divided by the total number of available hours (x 100).
As a result, a person billing for 32 hours of a 40-hour week would have an 80 percent utilization rate.
It is possible to compute utilization rates in various methods, depending on whether you are interested in pricing, employment, or the health of your organization.
Divide the total of all employee utilization rates by the total number of employees to arrive at your firm’s utilization rate.
Employee and company-level data can be gleaned from the most reliable time monitoring systems. You can consider administrative hours. It’s a better KPI if you take them out as your employees are not responsible for an internal meeting.
Most professional services firms have roles/skills that create roadblocks.
As an example, in software implementation, architects can be in high demand and rare to find. You’d think that the integrator is not putting in a good ratio of billable hours. But this is happening because he’s always waiting for the analysis to start the customization.
By recruiting a new architect, you’ll increase your integrator’s utilization.

14. Total utilization
- Formula: Total Billable Hours / total schedulable hours (by employee/skills/roles)
- Department: Operations
- Frequency: Monthly/Quarterly/Annually
- Goal: Analyze the overall business health.
- Rating: ⭐⭐
Total utilization is a term that indicates the relative volume of hours an employee delivers, regardless of the type of work being done.
It includes all hours worked with the same denominator of available hours. This metric is a good way to measure employees’ workloads and how effectively they are using their time.
However, it’s important to note that total utilization does not take into account the quality of the work being done or the results of the work. Therefore, total utilization should not be used as the sole criterion for assessing employee performance.
15. Cycle Time
- Formula: Time to execute a specific task
- Department: Operations
- Frequency: Annually
- Goal: Answer the ultimate question about life the universe and everything.
- Rating: ⭐⭐⭐⭐⭐
My brother is a mechanic. If you ever go to a mechanic shop, you’ll notice how everything is precalculated and each mechanic is evaluated from those cycle times.
Mechanics will get assigned specific tasks based on their previous performance vs. the cycle time. (Sorry, I ❤️ Cycle Time.)
It’s one of the most important KPIs here.
Defining cycle time by the task will help you create recipes to compare, benchmark, improve, and grow your business. We started using cycle time in our marketing department. As a result, we’ve seen a huge improvement in our content production capacities.
You can compare employee performance, increase profitability, set a consistent production, increase customer satisfaction, improve project scoping, and so much more.
The cycle time formula is the key to revealing the speed of delivery. It’s a crucial metric that allows you to measure how long it takes to deliver a service.
It can also be considered part of continuous improvement efforts since it can expose areas of inefficiencies that you and your team can address. It’s also a valuable metric when it comes to measuring productivity and efficiency within a business.
However, cycle time can be a bit of a mystery for some businesses.
The challenge is that cycle time can only be managed at the task level or a fixed-fee project.
Here is a video that explains how we use project and task templates in Klient PSA:
Interested? Try Klient Risk-Free →
16. On-Time Project Completion Rate
- Formula: # of Project completed before time / # of Project Completed
- # of projects completed under budget / # of Project Completed
- Department: Operations/Sales
- Frequency: Annually/Quarterly
- Goal: Review your ability to scope, quote, and execute projects in time and on budget.
- Rating: ⭐⭐⭐
On-Time Task Completion Rate is a measure of how often projects are completed on time. The goal is to get a completion rate as near as possible to 100%.
Knowing the On-Time Completion Rate acts as a starting point for improving project efficiency and can be tracked over time.
17. On-Time Task Completion Rate
- Formula: # of projects completed before time / # of Project Completed
- # of projects completed under budget / # of Project Completed
- Can be done by employee/role.
- Department: Operations/Sales
- Frequency: Annually/Quarterly
- Goal: Review your cycle time and employees for each task.
- Rating: ⭐⭐⭐
On-Time Task Completion Rate is a valuable metric for any organization, especially those who want to improve their project management skills.
18. Number of adjustments to the project
- Formula: Sum of adjustments done to a proj
- Department: Operations/Sales
- Frequency: Annually/Quarterly
- Goal: Review your ability to scope, quote, and execute projects in time and on budget.
- Rating: ⭐⭐⭐
Again, there is always a challenge in scoping and executing projects.
You want to identify the variance of the project scope vs. actual. It can be useful in fixed-fee projects to know if revisions are required for the initial scope.
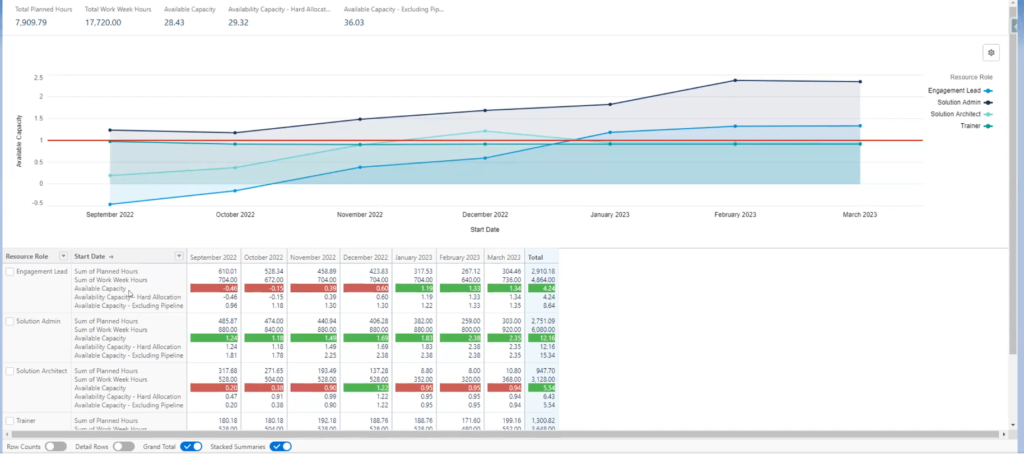
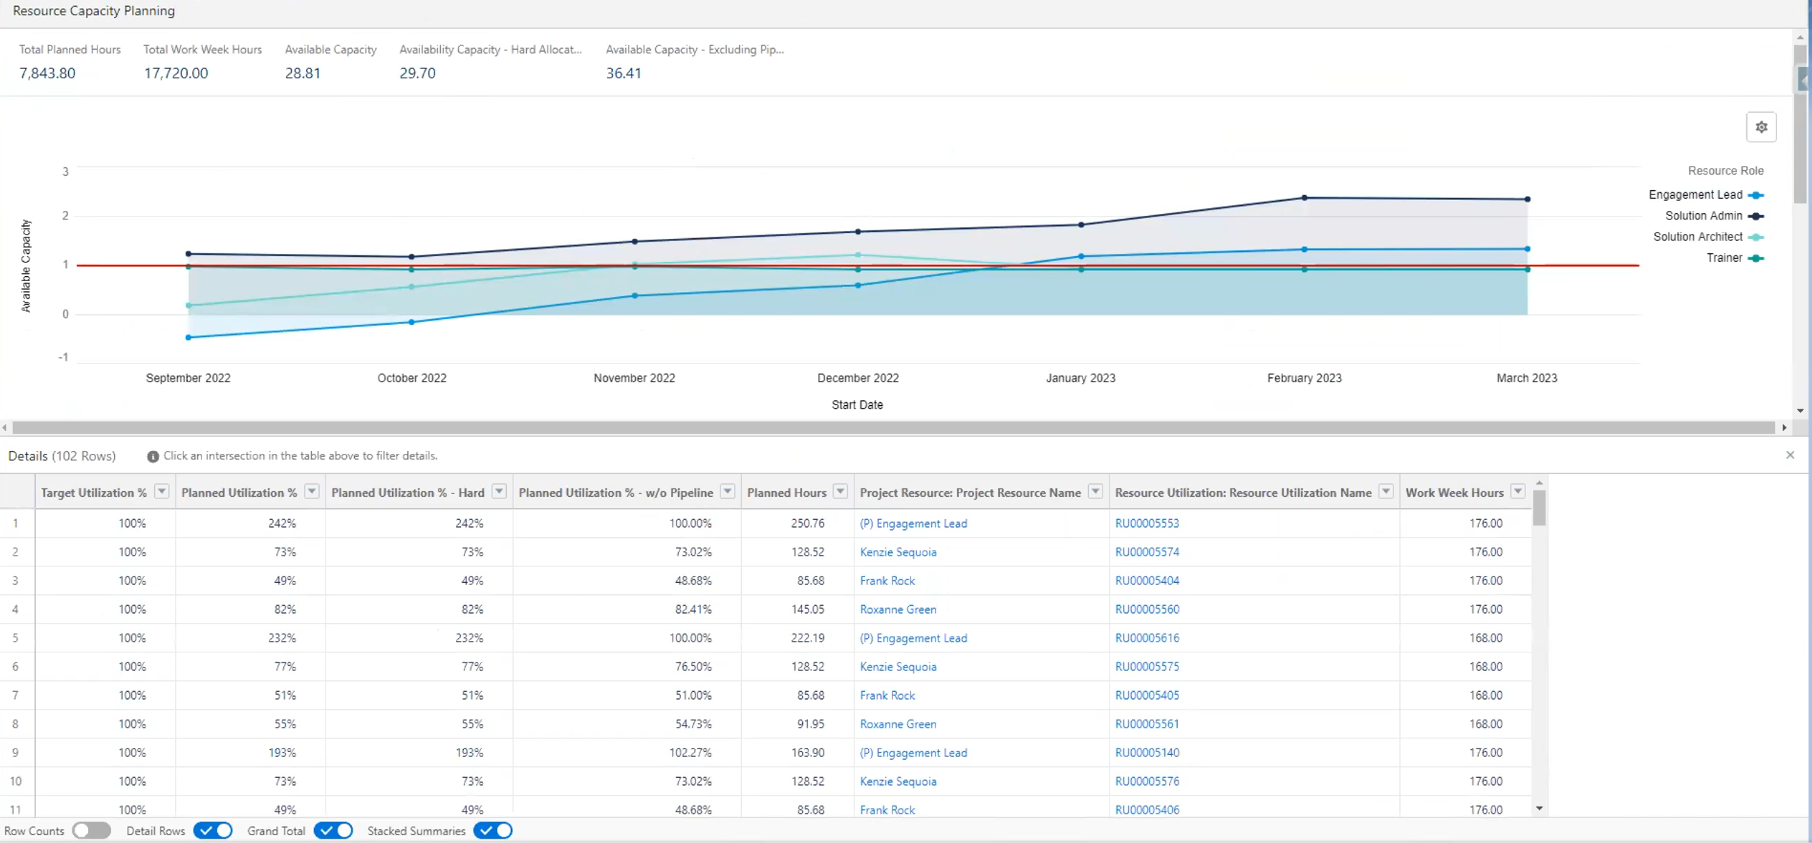
19. Resource Capacity
- Formula: # of scheduled hours / total billable hours
- Department: Operations
- Frequency: Weekly/Monthly
- Goal: Overview your needs in terms of new contracts or resources.
- Rating: ⭐⭐⭐⭐
For managers to better grasp their team’s capabilities, they need to calculate the capacity of their resources. To calculate the total number of hours worked throughout the measurement period, multiply the number of working days by eight.
Net work hours are calculated by deducting the time set for team meetings. Individual capacity for each resource is determined by subtracting time off for each team member from the total work hours and multiplying the result by availability. Calculate the total number of hours your team can work by adding the individual capacity of each resource.
This is why PSA software can give you that information in real-time.
20. Cost Variance
- Formula: Budgeted Cost/Actual Cost
- Department: Operations
- Frequency: Monthly/Quarterly/Yearly
- Goal: Cost and schedule variance can affect customer satisfaction. It can be an indicator of customer churn if the communication is not done correctly. It can also be a good KPI to manage your fixed fee offers.
- Rating: ⭐⭐⭐⭐⭐
The amount by which your project’s budget exceeds or falls short of your predetermined maximum is known as cost variance.
It’s best to keep an eye on cost and schedule variation, i.e., how early or late you meet project deadlines during your project.
21. Percentage of tasks completed
- Formula: # of tasks completed / # of tasks in the project
- Department: Operations
- Frequency: Weekly/Monthly
- Goal: It can be a good KPI to send in your weekly report. It’s not the best KPI as each task has a different duration.
- Rating: ⭐
A simple but intriguing KPI to keep track of…
Over time, the Percentage of Tasks Completed keeps tabs on how many jobs each employee has performed.
Although it’s useful to all departments, developers frequently use it to measure productivity.
In comparison to other departments, they may have a higher number of unfinished jobs. After all, they’re constantly juggling a slew of more minor – but no less critical – positions.
This is an excellent indicator for a manager, since it demonstrates how well each department has performed over the past few months. With this indicator, it becomes possible to temporarily provide more resources to one department or delegate some work to employees who are not under as much stress.
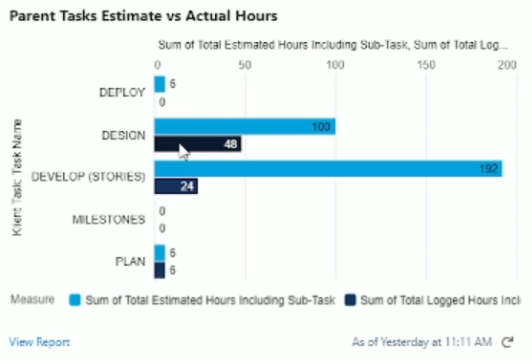
22. Planned vs. actual hours
- Formula: # of scheduled hours / total billable hours
- Department: Operations
- Frequency: Weekly/Monthly
- Goal: Have good visibility of your ability to execute the planned schedule. It can be a good KPI to evaluate team members and find tangents that can be affecting your team’s performance.
- Rating: ⭐⭐⭐⭐⭐
The most frequent KPI for assessing a planner’s efficiency is the plan vs. actual (also known as planner accuracy) ratio. It compares the estimated hours of work by the planner and the exact number of hours billed to a job.
23. Scheduled Variance
- Formula: Scheduled value / Expected value
- Department: Operations
- Frequency: Weekly/Monthly
- Goal: The Schedule Variance percent tells you how much the project is behind or ahead of schedule in percentage terms.
- Rating: ⭐⭐⭐
The Schedule Variance percentage tells you how much a project is behind or ahead of schedule in percentage terms.
When calculating schedule variance, use this formula:
A schedule variance percentage (SV%) is calculated by taking the scheduled value and dividing it by the expected value (PV).
24. Project Velocity
- Formula: # of story points/number of sprints
- Department: Operations
- Frequency: Weekly/Monthly
- Goal: A better fit for the development team. The goal is your team’s capacity to complete stories per sprint and forecast your whole project.
- Rating: ⭐⭐⭐
This metric is calculated by averaging the story points delivered across the previous sprints. The velocity should be determined across five sprints to obtain a reliable average.
Adore: 8 Professional Services KPIs to get the most from your customer service department
An organization’s overall key performance indicator (KPI) for measuring how satisfied and engaged employees are at any one time is known as employee satisfaction.
The metric combines several minor indications to get an overall picture of how happy and pleased your employees are at work.
25. NPS Score
- Formula: How likely is it that you would recommend this company to a friend or colleague?
- Promoters: 9 or 10
- Passives: 7 or 8
- Detractors : 0 to 6.
- NPS = % of Promoters ( — ) % of Detractors
- Department: Operations
- Frequency: Quarterly/Yearly
- Goal: NPS score is a great KPI. The challenge is most of the time it’s used on a really small sample. NPS scores are recommended on large samples (over 1 000).
- Rating: ⭐
If you want to know how your customers feel about your firm, you can use a net promoter score (NPS). It represents the percentage of clients likely to promote your company’s products or services.
Above 0 is good, above 20 is favorable, above 50 is excellent, and above 80 is world-class.
26. Customer Churn
- Formula: # of customers that stop using a service / total number of customers
- Department: Operations
- Frequency: Monthly/Quarterly
- Goal: The goal is to compare your acquisition rate to your customer churn rate. It will give your net customer growth.
- Rating: ⭐⭐⭐⭐
An important KPI for tracking customer retention is the Customer Churn Rate. It can be determined by dividing the number of consumers that stop using a service by the average number of users for a specific period.
27. Customer upsells/cross-sell rate
- Formula: Total quantity of upsell/cross-sells / Total number of customers
- Department: Operations
- Frequency: Monthly/Quarterly
- Goal: Having continuous relationships with your customers is essential to your success. Behind able to measure and compare customers on a ratio of “avg upsell/cross-sell rate” helps you identify/compare your customer base.
- Rating: ⭐⭐⭐
Cross-selling and up-selling programs can be measured in a variety of ways, including the following:
One approach to tell if upselling has occurred is to look at the average sales volume for each customer.
The number of items and services available to each customer increases as the company’s sales breadth increases.
You get a better cross-selling ratio when you divide the total number of products or services sold by the total number of customers. Cross-selling and up-selling efforts may have been unsuccessful if customer retention rates are higher than typical.
Customer attrition can be caused by various circumstances, including poor customer service.
28. Customer Complaints
- Formula: # of customers complaints / total number of customers
- Department: Operations
- Frequency: Monthly/Quarterly
- Goal: Identify if a customer has a higher complaints rate and identify the cause. Like in support, you want to identify which customers are consuming your services the most.
- Rating: ⭐⭐
Companies use KPIs to measure and track consumer satisfaction with their products, services, and experiences. The ultimate goal is to discover factors influencing customer satisfaction and identify potential growth and enhancement areas.
A few years back, one of my teachers at HEC, Yany Gregoire, talked about the double fault. Customers that complain are normally customers who want to keep working with your business. They only want a solution. By engaging in service recovery, they will most likely become your most loyal customer.
29. Employee Churn
- Formula: # of employees that left for a period of time / # of employees
- Department: Operations
- Frequency: Monthly/Quarterly
- Goal: Same as customer churn, it gives you visibility on how many employees you’ll need to hire to grow your business. Also, it can help you identify customers at risk.
- Rating: ⭐⭐
This metric is computed by taking the number of employees who leave and dividing it by the average number of employed people during that time. Assume that six of the ten outgoing employees left of their own volition, based on the data above.
Employee churn in professional services has a huge impact on customer retention. The knowledge transfer is frequently bad and if a customer endures multiple churns in a short period of time, they are most likely to leave the company as well.
30. Team Satisfaction
- Formula: There is great software like Office Vibes that can get a multi-factorial vibe for your team.
- Department: Operations
- Frequency: Monthly/Quarterly
- Goal: Increase employee satisfaction and retention.
- Rating: ⭐⭐⭐
To know how happy and engaged your employees are at any given time; you need to assess employee satisfaction.
The metric combines several minor indications to get an overall picture of how happy and pleased your employees are at work.
31. Number of change requests
- Formula: # of change requests
- Department: Operations
- Frequency: Weekly/Monthly/Quarterly
- Goal: Identify either a customer/consultant/project going off-track.
- Rating: ⭐⭐
Using this KPI, you may better understand the approval process and see whether you need to make any adjustments.
This aspect can help improve the communication between the service provider and the client.
Change request affects the scope, cost, and timeline of a project. A large variation from the initial scope can slightly move the project from its initial objectives. Following the 80/20 rule, these projects will end up costing a lot in requests that aren’t essential to the organization.
By monitoring this KPI, you can identify a project/consultant/customer going off-track and verify if those changes are within the project objectives.
32. Avg. backlogs/requests per customer
KPI for customer service teams is the total number of customers who have submitted a support request.
Keeping tabs on the top line is just the beginning; you’ll also need to look at how the volume changes with the year’s hours, days, and seasons.
Scale: 11 Professional Services KPIs To Ensure that your Firm has the best margins
Key Performance Indicator (KPI) and Return on Investment (ROI) are acronyms used in Digital Marketing.
Digital marketing uses the phrase “Key Performance Indicators” to describe the marketing measures used to evaluate a digital marketing campaign’s performance.
33. Annual/Monthly Revenue per Billable Employee/Roles
The ratio of revenue generated per employee is crucial since it approximates the amount of money each employee brings into the business.
To get a company’s revenue per employee, divide the company’s total income by the number of employees it currently has on staff.
34. Annual /Monthly utilization per billable employee/roles
In project-based services, billable utilization refers to the percentage of available hours personnel spend earning money. The formula for the usage rate is as follows:
To calculate a company’s billable utilization percentage, multiply the total billing hours by the total available working hours by 100 percent.
For most professional services organizations, the billable utilization rate is a key performance indicator (KPI).
35. Annual/Monthly Overhead by Billable Employee/Roles
Divide the monthly sales by the entire monthly overhead costs to arrive at the overhead rate.
To determine your overhead rate, multiply this value by 100.
36. Percentage of non-billable hours
Productivity can be measured by the percentage of billable hours your technicians spend on billable tasks for a customer.
Field service firms frequently monitor this KPI since it is more financially oriented. The most significant component of most KPIs or metrics is what you do with them — in other words, how the KPI drives decision-making.
The percentage of billable hours makes this crystal clear. These technicians are more productive if they have a large portion of their work time being billable hours, while the less effective technicians spend most of their time on non-billable jobs.
37. Time to invoice
Hourly work is invoiced by calculating the hourly rate for each activity and providing a detailed explanation of each performed task.
The hourly invoice keeps track of the time spent on a project and clarifies when it’s time to get paid.
38. Invoice Processing/Creation Time
Regarding overall departmental efficiency, measuring costs per invoice handled provides the organization’s first insight.
The infrastructure and follow-up, personnel pay, management overhead, and IT support are only some of the costs associated with processing an invoice.
39. Average approval time
Using this KPI, you can see how long it takes for customers to complete a purchase order in a shopping cart. It’s based on a year’s worth of data, returning to the prior year.
A total of four measurements can be shown on the app. For each day of the week, there are four price ranges: low, medium, high, and very high (Main Measure).
It shows the average approval time for low, medium, high, and high-cost items. In advance, you need to establish a set of acceptable values.
40. Invoice cycle time
Using this KPI, you can see how long it takes on average to invoice a given percentage of your line volume.
The invoice fill rate option allows you to set this proportion.
41. Average invoice value
For the average transaction value, multiply the total amount by the number of transactions, equal to how many sales there were during the time in question.
This can be computed on a daily, monthly, or yearly basis.
42. Net profit margin
After subtracting all of your operational expenses, taxes, interest, and depreciation, your net profit is the genuine profit that remains.
The net profit margin is calculated by dividing the total revenue by the entire profit margin.
43. Selling, General, and Administrative (SG&A) Ratio
- Formula: Total SG&A / Total sales revenue
Total SG&A = Direct selling expenses (Commissions/Selling Fees) + Indirect selling expenses (Marketing/Sales wages + Marketing Budget) + Administrative Expenses (Rent, Utilities, Supplies, Administrative staff wages)
- Department: Administration
- Frequency: Annually
SG&A affects a company’s profitability and break-even point. The point of equilibrium is when revenue and expenses are equal.
It’s one of the most accessible places to find methods to boost profits.
Non-sales staff salaries may usually be cut without hurting production or sales. After a merger or acquisition, SG&A is a top cost-cutting target. It’s an easy target for management teams looking to boost profitability.
Keep Your KPIs On Track
Key performance indicators are used to measure the success of a company’s strategic, financial, and operational goals compared to those of other businesses in the same industry.
Among the monetary metrics that can be used are net profit (also known as the bottom line or gross profit margin), revenues less specific costs, and the current ratio (liquidity and cash availability).
Most customer-focused key performance indicators (KPIs) are geared toward improving efficiency, delighting customers, and ensuring they return.
Want to keep your KPIs on track and keep your business running smoothly? Klient PSA helps you run your entire business on one platform! This makes it easier than ever to keep track of every KPI you need to grow your business sustainably.
![]()
You liked this Klient Tip? Share it with your team!
Discover more articles from Klient
Replace all your tools with Klient, Salesforce #1 PSA platform
Run your entire SaaS and consulting business on a single professional service automation platform native to Salesforce!