Project management is a complicated beast, mainly because it requires monitoring resources. And resources – whether people, time, or money – can rapidly disappear.
However, with resource histogram project management, project managers (PMs) don’t have to panic. That’s because resource histograms tell them exactly where the budget is going daily and where they might tweak things to get the project back on track.
Resource histograms are just one way PMs can streamline processes and protect themselves from unexpected situations. Fortunately, companies seem to be catching up to the importance of being prepared. According to the Project Management Institute (PMI), wasted funding due to poor project management (e.g., budget overshoots, scope creep, and missed deadlines) has declined to 9.4 percent in 2021 compared with 11.4 percent in 2020.
With that being said, they’re just one of several tools you can leverage to manage your resources.
In this overview, we’ll walk you through your burning questions about resource histograms, how to build and implement one, and what other tools you can use effectively track and manage every source for any project.
[button link=”https://klient.com/trial-ceremony-call/” short_code newwindow=”yes”] Get A Risk-Free Trial Of Klient PSA[/button]
- What is a Resource Histogram?
- Why Use a Resource Histogram?
- When to Use a Resource Histogram
- Introduction to Resource Leveling
- Introduction to Resource Smoothing
- How to Build a Resource Histogram on Excel/Google Sheets?
What Is a Resource Histogram?
A resource histogram is a visualization and statistical tool used to manage resources. Typically, a simple table might give you an idea of how you monitor your resources daily, but it’s hard to visualize information that way.
(Also, let’s face it, tables can be boring).
By turning your tables into resource histograms, you can easily see at a glance how well you’re keeping everything on track. You can also find out if daily costs are exceeding the budget.
You might have guessed it, but the first step to build a histogram is to establish the resource cutoff per day. Without this clarity, it can be very easy to overshoot spending or over-allocate your resources.
Next is creating a “table of dependencies,” where you record details like types of activities, how long these activities will take, and how much they will cost per day. From this information, you can create a simple Gantt chart to visualize the data.
Most people stop at this part. But if you take a step further and create a histogram, then you can have a better guide on when to move resources around or when to delay the due dates. We highly recommend two great videos from Engineer4Free that explain this concept really well. But, don’t worry, we’ll also break everything down in the rest of this article.
Video #1: Resource histogram explained for project management
Video 2: Resource constraining example with resource histogram
However, to give you a better context, we will explain the concept further with some nuance.
Why Use a Resource Histogram?
Aside from getting a cool visualization tool, resource histograms give you detailed information on the progress of your projects.
In particular, some tasks are too complex and have many components; without a resource histogram, it’s like getting lost in a maze. You can have multiple activities/resources that overlap on a project.
This is where the resource histogram comes in. As a project manager, you can map out your resources on a resource histogram to make sure everything is correctly allocated.
Once you have your histogram, you can measure resource utilization and make sure you’re neither underutilized nor overextended.
When to Use a Resource Histogram?
A project manager can use a resource histogram at any point in a project. It can be a handy tool, even if it takes time and effort to create one in Excel. (It can even be manually created on paper, although this takes longer and is prone to errors.)
The resource histogram can help project managers figure out how profitable a particular activity is and which activities are interdependent. They can also monitor different processes and make data-based decisions.
For example, they can determine which part of the project might benefit from added resources or have been over-allocated for quite some time.
Below are other examples of when a resource histogram is most beneficial.
- You have a limited budget and must stick to it to the last dollar. Sometimes, budgets are incredibly tight, and overspending even for a few hundred dollars can lead to the dreaded scope creep (when unplanned tasks keep adding up, most of which were not initially included in the budget allocation).
- You want to limit the number of daily resources assign for a project. For example, you have a specific role that executes a particular task and want to monitor that these tasks/roles don’t excessively overlap or get unnecessarily duplicated.
To demonstrate this, let’s say we have five parent tasks for the whole project.
| Task | Predecessor | Duration | Start Day | End Day | Cost / Day |
| Analysis | – | 2 | 0 | 2 | 1560 |
| Architecture | Analysis | 3 | 3 | 5 | 1680 |
| Configuration | Architecture | 3 | 6 | 8 | 1680 |
| Implementation | Architecture | 2 | 6 | 7 | 1520 |
| Training | Implementation | 3 | 7 | 10 | 1400 |
In the table of dependencies below, you can see that each task/role is clearly specified per day, along with their corresponding budgets. Being detailed as much as possible helps to create relevant and accurate histograms.
| Day | Task | Total Daily Cost |
| 1 | Analysis | 1560 |
| 2 | Analysis | 1560 |
| 3 | Architecture | 1680 |
| 4 | Architecture | 1680 |
| 5 | Architecture | 1680 |
| 6 | Configuration + Implementation | 3200 |
| 7 | Configuration + Implementation | 3200 |
| 8 | Configuration + Training | 3080 |
| 9 | Training | 1400 |
| 10 | Training | 1400 |
This kind of table is simple to create on the fly. However, it’s a nightmare for a 6-month project. This is the kind of report that PSA software can generate quickly.
Pros and Cons of a Resource Histogram
While resource histograms are very useful, they also have certain limitations. For one, it feels outdated and should have been automated long ago. But resource histograms do serve a purpose, and PMs continue to benefit from this simple but informational tool.
Pros:
- They allow users to compare and contrast data easily.
- The data can cover a long period range (e.g., monthly or annually).
- References are easy to find if you need help with this tool.
Cons:
- It can be difficult to compare different categories because histograms work best with one dataset over a long period.
- They can require a lot of file space just to display basic information.
- They can present misleading or incomplete data if the parameters are not clarified in the first place.
What can you do with a Resource Histogram?
Resource histograms enable PMs to do two main strategies: resource leveling and resource smoothing.
Let’s go over each of these terms to clarify why a resource histogram can come in handy.
Introduction to Resource leveling
Let’s say you discovered through your resource histogram that there are three days when the project exceeds the daily budget or time limit. You can then re-shuffle major activities to move some tasks to the days below the resource limits, which levels the playing field and avoids strains on your team.
When to use resource leveling
Resource leveling basically ensures that resources are spread evenly throughout all projects for a given customer. Here are some examples of when to apply this technique.
- To maximize resources. As we described earlier, projects can have multiple tasks, and companies can have various projects simultaneously. With resource leveling, PMs can ensure that resources are reallocated as needed.
- To give teams work-life balance. For groups overworking or exceeding time limits, PMs can either bring in other employees to help or push back the timeline to accommodate incontrollable delays (e.g., experiments and test results).
- To manage client expectations and output quality. PMs can efficiently update their clients on how resources are allocated while maintaining the quality of every deliverable.
Resource leveling examples
Here are more concrete situations where resource leveling works best:
Moving a project completion date
Let’s say a user interface (UI) developer team is refreshing an e-commerce website for re-launch within the week.
However, a bug fix has been delayed for a couple of days. Since it is very critical to ensure that all bugs have been fixed beforehand, the PM can choose to extend the deadline to the following week.
To make up for the lost time, the PM can maybe tweak the due dates of some minor tasks.
Moving a project start date
A large project is due to start by next week, but the requirements/specifications from the customer are still not complete.
The PM communicates to the customer that since they don’t have all the needed information yet and that they will have to start a few days later. The PM then gives the customer choices on how they want to reallocate resources to compensate for the lost time caused by the customer’s delay.
Short on staffing
Imagine if a team of software engineers got sick at the same time. A project needs to be delivered to the customer by next week.
The PM can then reallocate some of the engineers from the other projects that are not due yet to help out in the meantime.
Introduction to Resource Smoothing
Resource smoothing is usually done after resource leveling. In leveling, the primary constraint is resources; in smoothing, it’s time or schedule. After everything has been reallocated, a project manager may notice that there are still some workdays that exceed the limit within the new plan. The PM can then reallocate tasks and teams without major re-shuffles, particularly in critical activities.
Learn more: Resource smoothing and leveling
When to use resource smoothing
Smoothing ensures that things are going according to plan and that the project won’t have any more significant shifts or scope creep. Here are some examples of when to use resource smoothing.
- The project deadline is set in stone. PMs can look at their histograms and ensure that work hours and labor are evenly allocated across the remaining days/months.
- The critical paths/activities are not going to be affected. As long as the main tasks are going along as scheduled, then some small re-shuffles (a day or two) will be fine.
- Some minor activities can be paused within their timeframe. To make room for other more crucial tasks, some activities can be slightly delayed without much impact on the overall project timeline.
Resource smoothing examples
To better visualize how this technique works, here are some sample situations where resource smoothing works best.
- The project is due within the week, and the PM sees that everyone seems to be working overtime on Wednesday. The PM can reallocate the excess work hours to the other weekdays to smooth out the schedule.
- A website banner is due for review on Monday, but the Design Manager is on leave and will return on Wednesday. The PM can pause the review until the manager returns. Fortunately, the manager will still be able to finish the task before the banner’s scheduled to release on Friday.
How to Build a Resource Histogram on Excel/Google Sheets
First of all, it’s much simpler to use project management software or PSA software to manage a resource histogram. But if you’re still using Excel for those reports, it’s relatively easy to set up.
Now that we’ve gone through the background and essential characteristics of resource histograms, let’s look at how we can build them. We’ll start with a relatively simple example.
First, we need to create a table of dependencies on Microsoft Excel. For example, the table below shows the number of employees required per month.
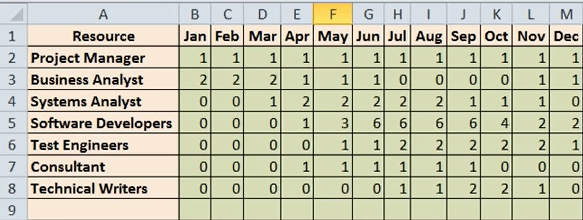
Next, select the entire table, including the titles and headings, and click the Insert tab. Under Column, select the Stacked Column in 3-D (under 3-D Column). (You can also choose the 2-D version, but in general, stacked columns work best).
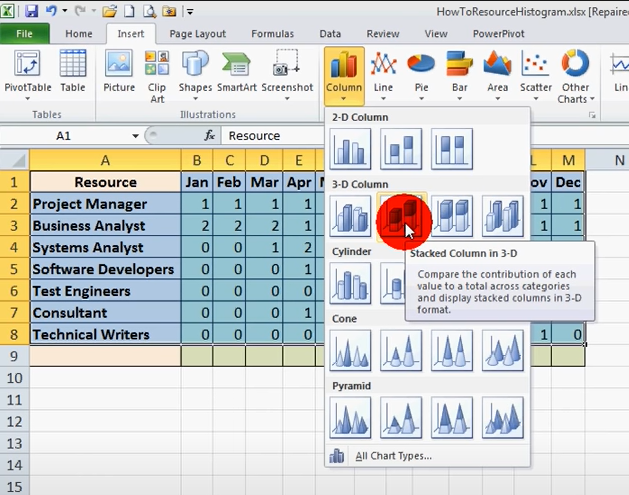
Our table of dependencies should be transformed into this:
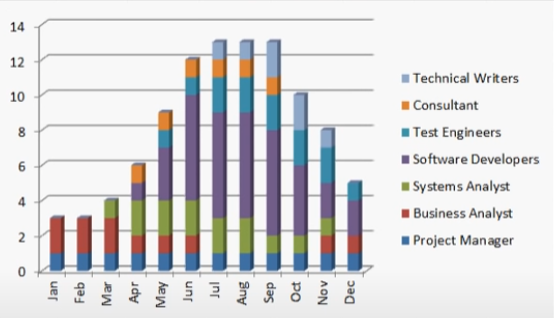
Source: Watch the complete video from Eugene O’Loughlin on how to Create a Resource Histogram in Excel.
As you can see from this basic resource histogram, you can include or change additional information, like extending the months or adding more roles/employees.
This way, PMs can immediately see the months where employees would be needed more (e.g., July-September on the sample histogram). The team can then prepare in advance for these periods, including hiring additional staff if required.
Another way to read this histogram is if there’s an employee limit. For example, let’s say the customer only wants to pay for 10 employees max for this project.
By referring to the histogram, PMs can choose to shuffle specific tasks so that they are performed in the first quarter or last quarter of the year, where resource allocation is much lower.
Resource histograms can be simple to create but can give valuable detail. It all depends on how PMs want to use and adjust them to the project’s needs.
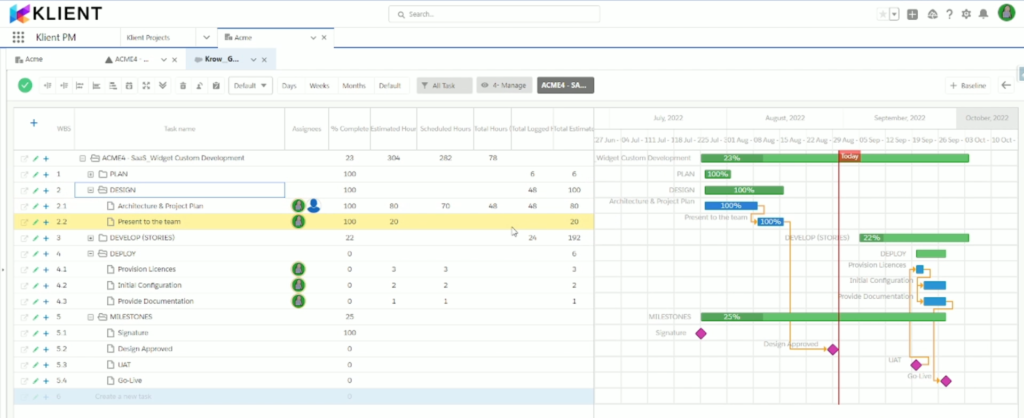
An alternative to resource histograms: How to use a PSA to plan your resources
Despite their use, resource histograms do have their limitations. When you have complex projects with several moving parts, you’ll need a more robust tool to allocate and manage resources and maximize utilization.
You can leverage several types of views for every project in your pipeline and easily figure out in a single glance:
- Who is assigned to what
- Estimated hours for each task
- Only specific tasks (such as Milestones)
- Availability of every single resource
- Granular view of a resource’s schedule at the task level
- Available resources in your organization if you need to replace a particular resource
- And so much more!
In this video, watch how a Professional Services Automation (PSA) tool replaces a Resource Histogram with little to no effort:
Need a robust resource management tool for your business?
You don’t need to be an Excel wiz to do this kind of report. This is why a solution like Klient can help you out!
If you want a resource management tool that’s automated, flexible, and highly customizable, Klient can build one that’s tailored specifically for your business. We can help you take control and manage staffing, and allocate tasks appropriately and intuitively.
The best part? You can try Klient risk-free! Click below to request your free trial of Klient PSA:
[button link=”https://klient.com/trial-ceremony-call/” short_code newwindow=”yes”] Get A Risk-Free Trial Of Klient PSA[/button]
![]()
You liked this Klient Tip? Share it with your team!
Discover more articles from Klient
Replace all your tools with Klient, Salesforce #1 PSA platform
Run your entire SaaS and consulting business on a single professional service automation platform native to Salesforce!