Rosalie and Yanick gave a 30-minute first look at Klient Insights, the new dashboards in Klient PSA 51.13: four live demos built around the questions of a weekly services review, then how to roll it out.
Webinar chapters
00:00 Welcome
02:38 What is Klient Insights?
03:10 Why we built it
03:58 The four questions of a weekly review
04:50 Demo 1: Account & Project Scorecard
08:34 Demo 2: Where revenue is leaking
12:09 Demo 3: Favourites and Play
16:53 Demo 4: Change a dashboard with GUIDY1
20:43 Edit a dashboard by hand
24:37 Get started in four steps
25:31 Share a dashboard
27:53 Resources and what’s next
What is Klient Insights? 02:38
Klient Insights is live dashboards on your Klient PSA data, right inside Salesforce: your projects, people, time and billing. It ships with 19 ready-made dashboards built for services teams, and you change them on screen, with no reports to build. It is part of Klient PSA from version 51.13, at no extra cost.
Why we built it 03:10
It started with a customer request. Standard Salesforce dashboards answer one question at a time: each chart needs its own source report, joining objects needs a report type, and what won’t join ends up in a spreadsheet. Klient PSA has a lot of related objects, so we built a new engine where one chart can join projects, time and invoices, and every filter changes the whole dashboard. More in How is Klient Insights different from Salesforce reports and dashboards?
The four questions of a weekly review 03:58
Most weekly reviews come down to four questions, and each demo answered one of them: Are we making money on this work? Who is on the bench, and who is overbooked? Where is revenue leaking? What will slip this week?
Demo 1: Are we making money, client by client? 04:50
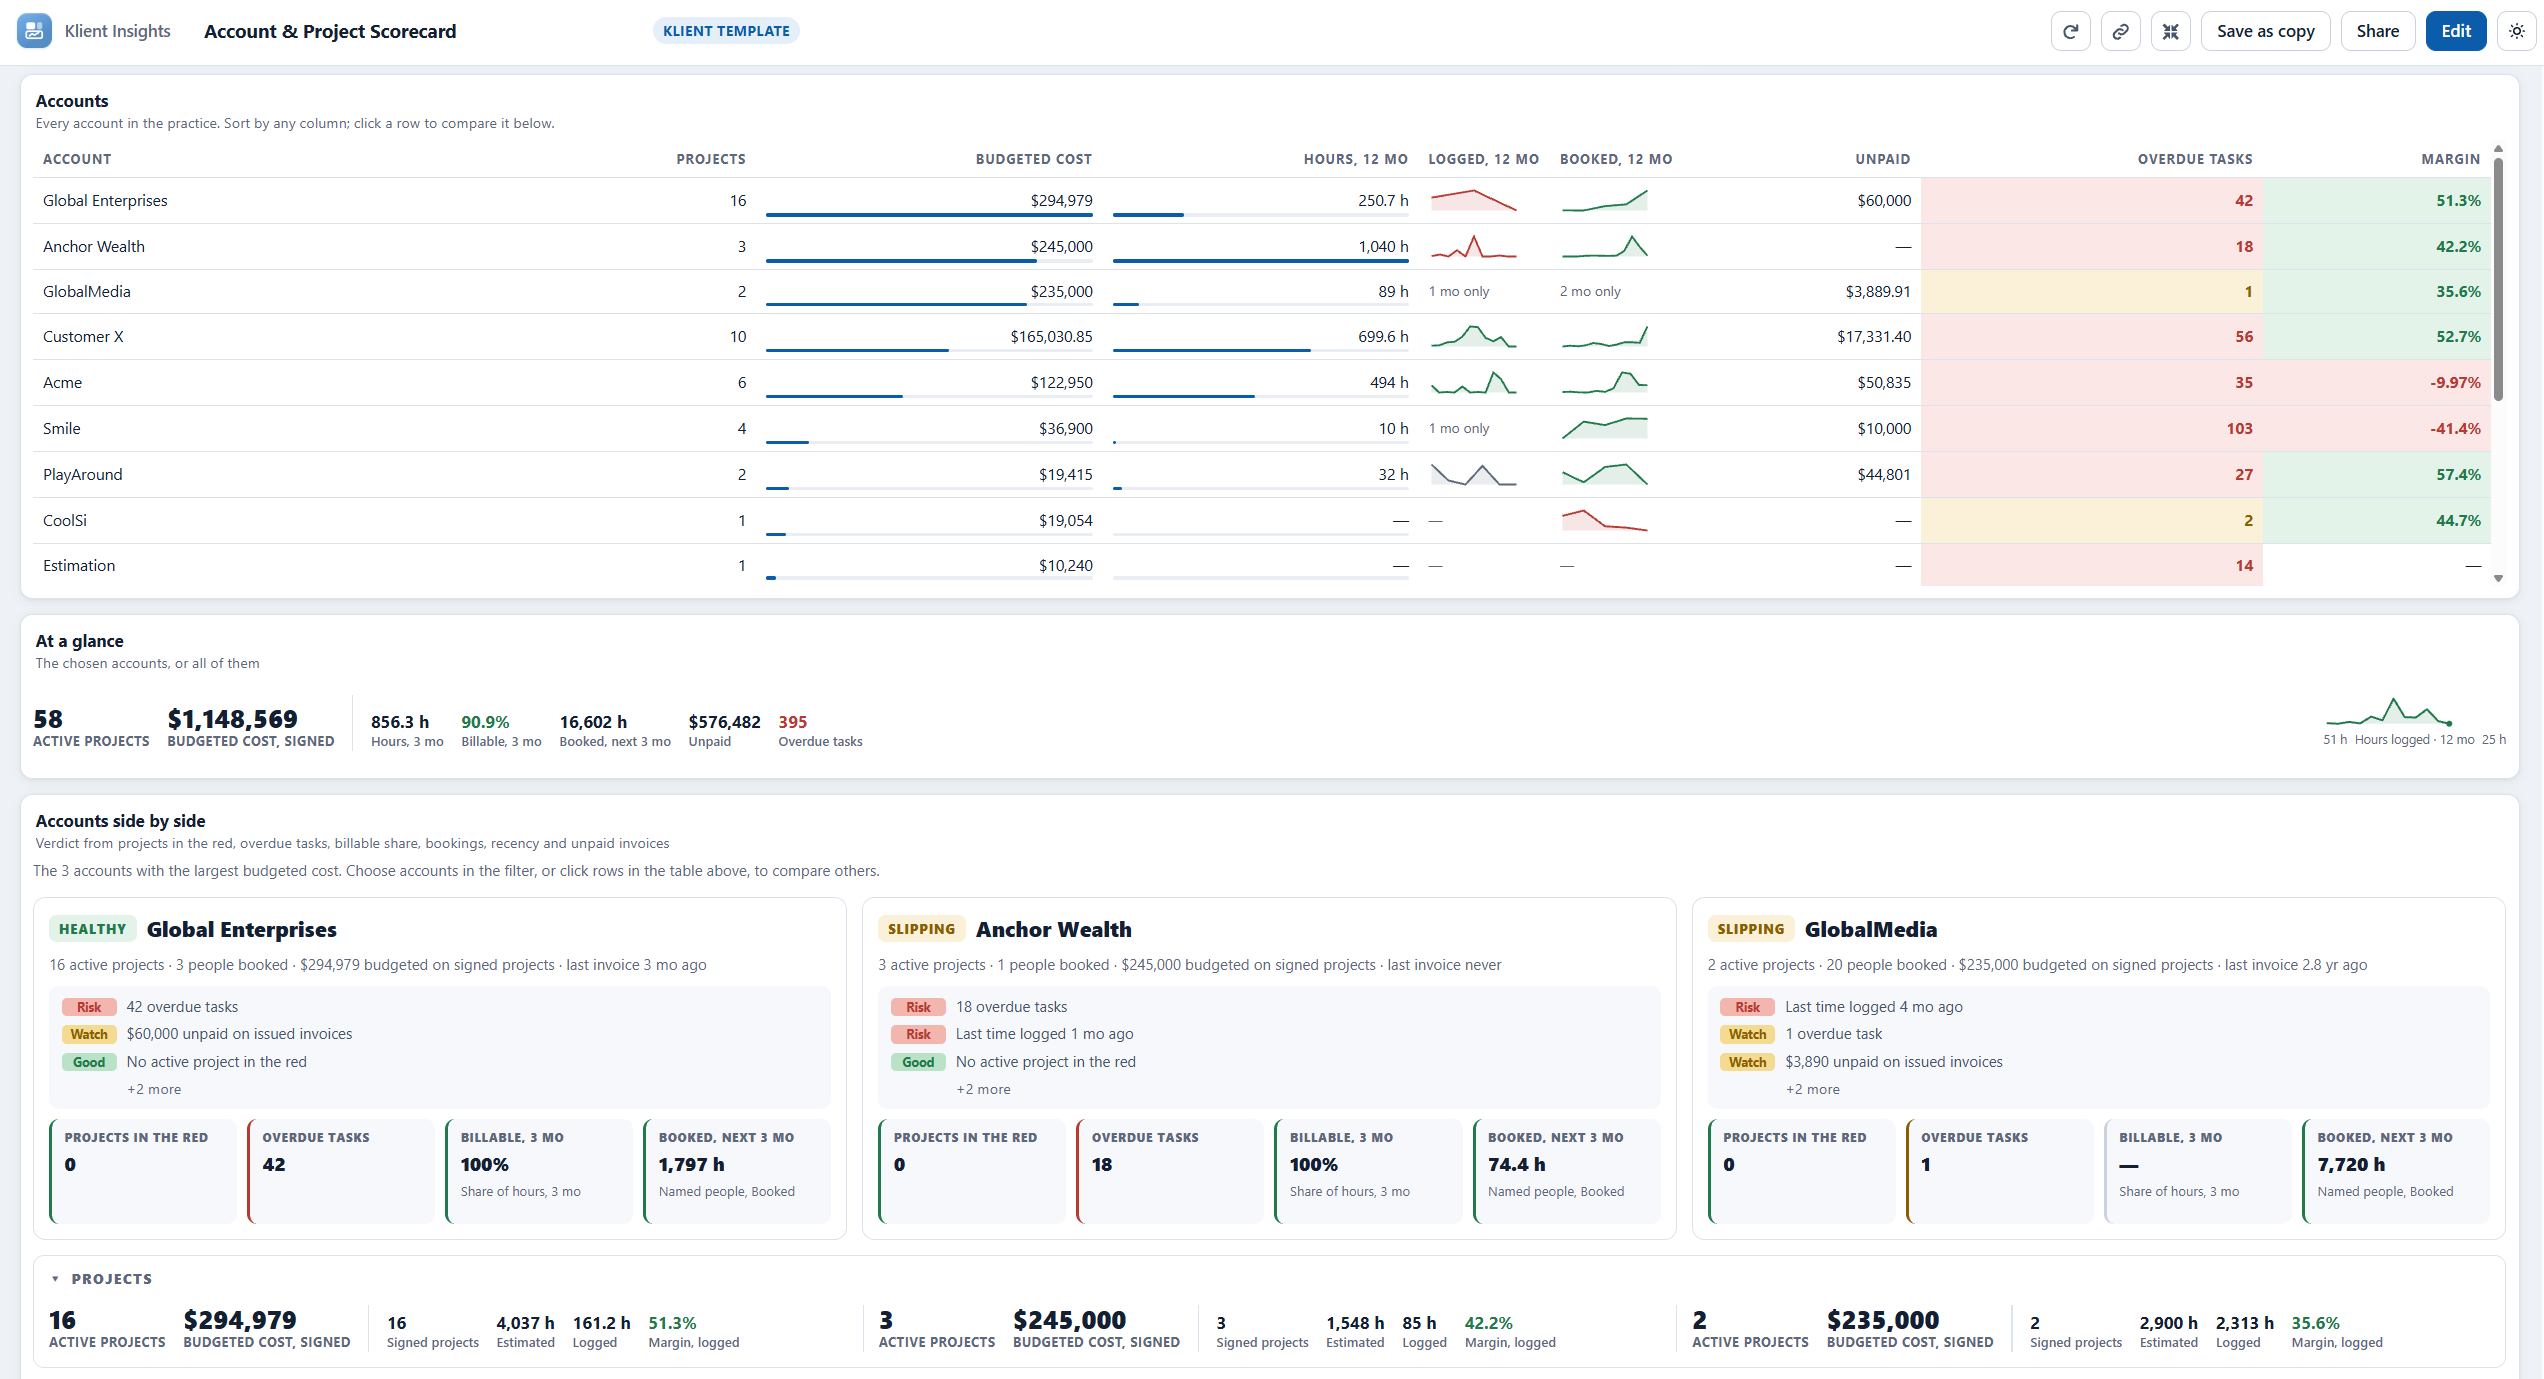
The Account & Project Scorecard puts every client in one table. Sort by margin and the clients losing money come first. Click one (Ctrl+click for several) and the whole dashboard follows: overdue tasks, the last time hours were logged, unpaid invoices, the share of hours that is billable, and every project of that account below.
Demo 2: Where is revenue leaking? 08:34
On Revenue & Billing, the demo data showed about 3,500 billable hours from the past year that were never invoiced, and which project caused most of it. Almost every chart is clickable: click a number to see the records behind it, then open any record in Salesforce.
The Data Health dashboard is the admin’s gold mine: live projects without a budget, stale projects with a due date in the past, billable hours with no rate. Check it once a week.
Demo 3: Run the meeting from it: favourites and Play 12:09
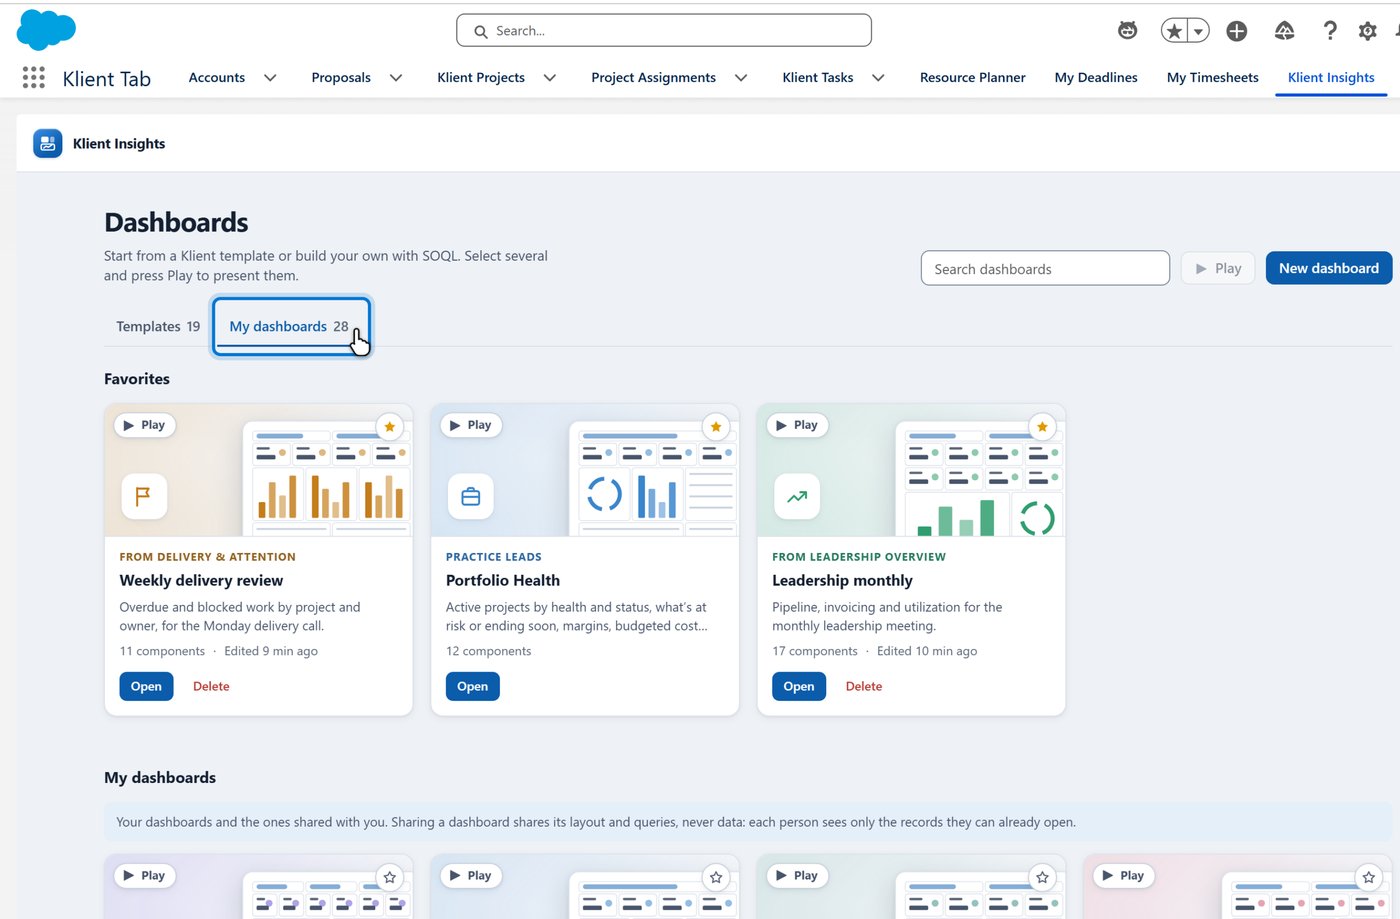
Star the dashboards you use and they land in your favourites. Pick a few and press Play: they run full screen, one after the other, so the Monday meeting needs no deck. Yanick played Portfolio Health (what will slip), Resource Utilization (who is busy, who is not, against their schedule) and Project Budget & Burn, which also reads your Snap Workspace data.
Demo 4: Change any dashboard with GUIDY1 16:53
Yanick made a copy of Revenue & Billing and asked GUIDY1, Klient’s Agentforce guide, for a table of the top clients with billable time not yet invoiced. GUIDY1 added the component. He then asked for a new bench-and-booking dashboard from scratch: GUIDY1 asked its questions, proposed three components (a heat map and two bar charts) and built it.
Or edit it by hand 20:43
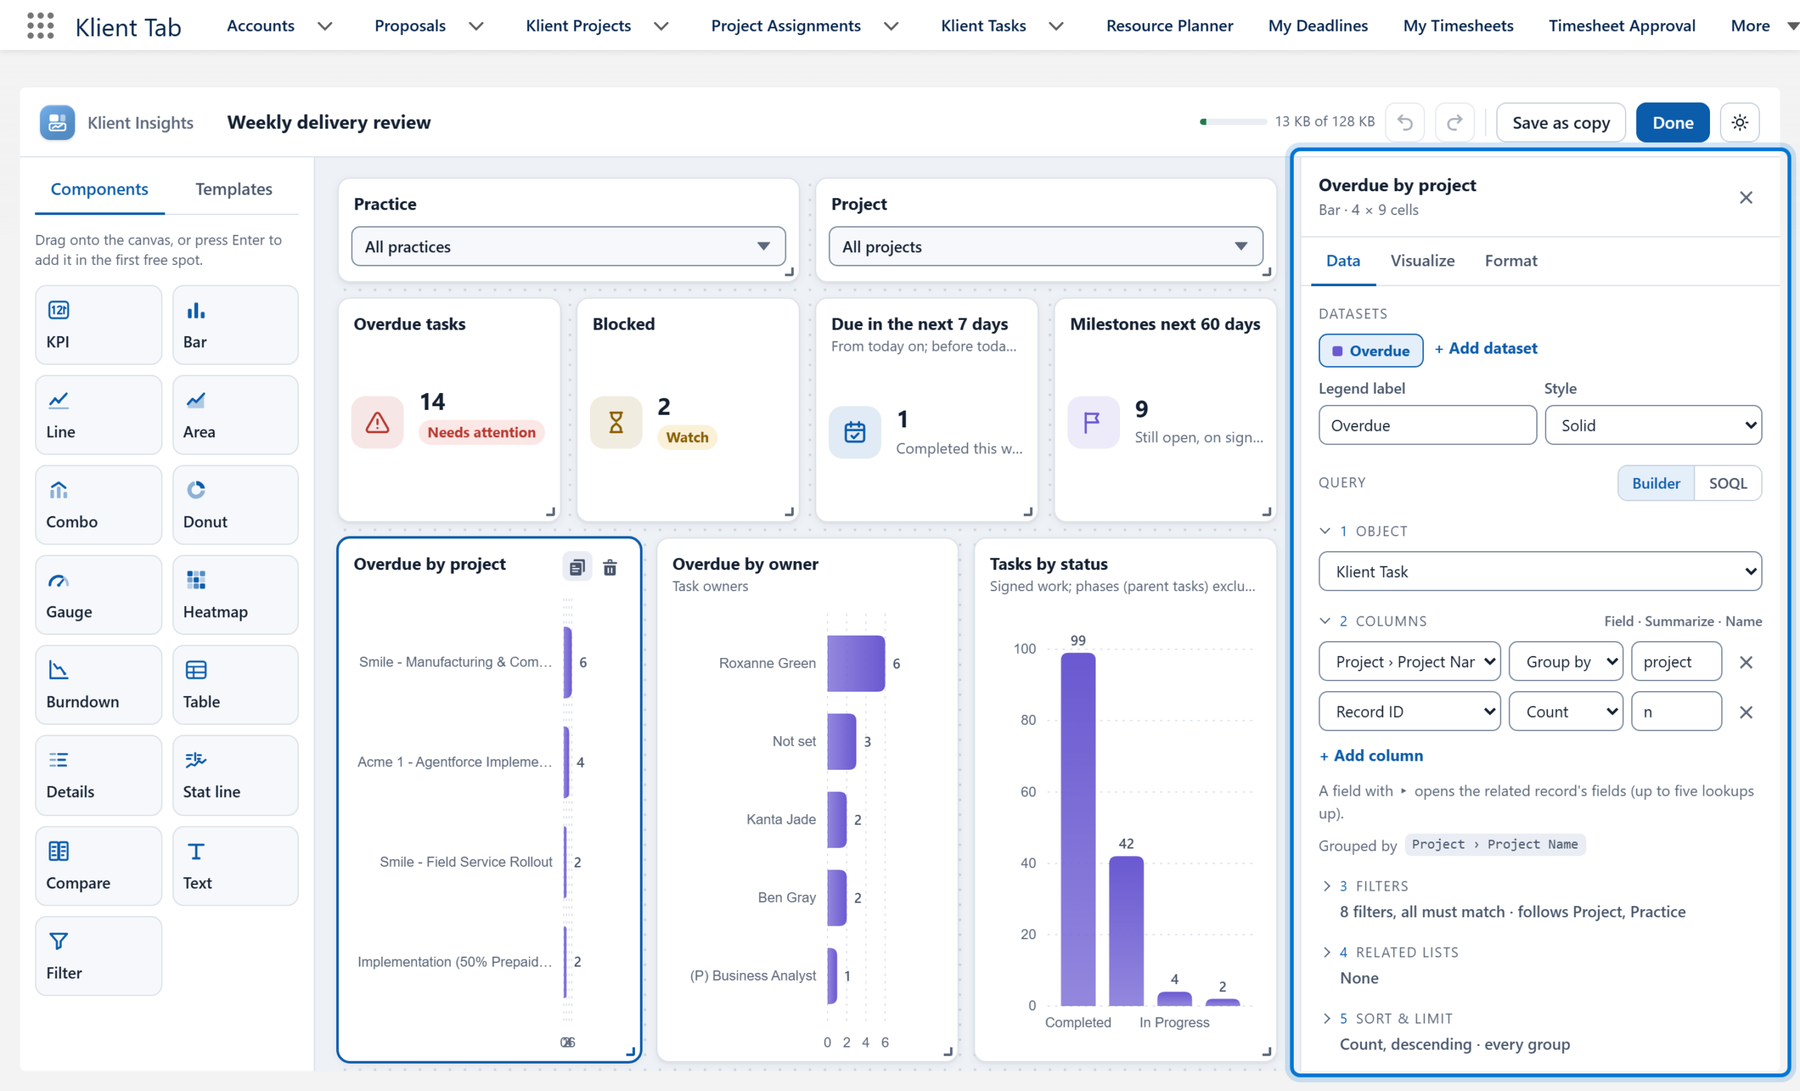
In edit mode, drag a component from the palette, pick the object and fields (the most used objects come first), add filters, then choose how to show it and its colours. Under the hood every chart runs a SOQL query, so anything in your org can be plotted. Klient templates are read-only: Edit or Save as copy gives you your own dashboard to change.
Get started in four steps 24:37
- Be on 51.13. The Klient Insights tab is in the Klient PSA app; add it to your navigation bar.
- Check permissions. Klient permission set groups already include it. With custom permission sets, assign Dashboards Viewer, Creator or Admin (see the Admin Guide).
- Start with four: Project Budget & Burn, Resource Utilization, Revenue & Billing and Portfolio Health.
- Make it yours: copy, change, share, or add it to a record page.
Share a dashboard 25:31
Share a dashboard with people, groups or roles, copy its link, or copy it as an image to paste in Slack. Sharing shares the layout, never the data: each person sees what their own access allows.
Get the slides
Want the deck from the webinar, with every dashboard we showed? Tell us where to send it.
Free download
Download the webinar deck
Get the full slide deck from this session — we'll email it straight to your inbox.
PDF · free · no spam
Keep learning
- Klient Insights Feature Spotlight (5 minutes, to share with your team)
- Quick Start Guide
- Admin Guide (setup and permissions)
- Klient Insights eLearning
- Release notes 51.13
- Missing something? Post it on the Ideas Exchange.
Frequently asked questions
What do I need to use Klient Insights?
Klient PSA 51.13 or later and a Klient PSA license. Users in a Klient permission set group already have access; orgs with custom permission sets assign Klient PSA – Dashboards Viewer, Creator or Admin. It is included in Klient PSA at no extra cost.
How is Klient Insights different from Salesforce reports and dashboards?
One component can join objects, every dashboard filter feeds each query, and filters narrow each other, so you don’t need one source report per chart or a custom report type. Read the full answer.
How is it different from Snap Workspace?
Snap Workspace compares project snapshots over time; Klient Insights shows where everything stands today. Project Budget & Burn reads your snaps too, so you can use both. More.
Can I change a Klient template?
Templates are read-only. Edit or Save as copy gives you your own dashboard, which you can change by hand or with GUIDY1. More.
Does sharing a dashboard share my data?
No. Sharing shares the layout and queries, never data. Every query runs with the viewer’s access, so a colleague may see different numbers, or “Hidden” for a field they can’t access. More.
Can I put a dashboard on a project, account or resource page?
Yes. An admin adds the Klient Insights component to the record page in Lightning App Builder, and the dashboard filters by that record. More.
What do I need for GUIDY1?
GUIDY1 runs on Agentforce, so your org needs Salesforce Flex Credits (your Salesforce account executive can tell you). Install it from My Products on the Feature Hub. See the GUIDY1 Quick Start Guide.
Join us next time
Our next webinar is the November 19 product update, then the last one of the year on December 10. Register for the next Klient PSA webinar; if you can’t join live, the recording is posted here afterwards.
you see and this helps us as well finding out what’s our best features Hopefully. Yeah, so you can ask questions as well, answer the polls, react, and then everything is recorded anyways. But yeah, don’t hesitate. I’m sure people will have a lot to say about today’s webinar. All right, so here’s a plan for the next 30 minutes. This is a shorter webinar We’ll talk about what Klient Insights is, why we built it, then we do four live demos. Yanick is going to do that, that answer a few key questions. Then we finish with how to get started if everything we covered today is interesting to you. Before we dive in, we have two questions. This is going to help us know
how far you are with Klient Insights. So there’s two things we want to know, and it’s going to help Yanick kind of direct the demo. Have you tried Klient Insights yet? I know a lot of customers have already upgraded, so depending on that, you may have touched on it or not Yes. And how do you run your Monday review today? So are you using Salesforce report, maybe a spreadsheet, any BI tools, or you don’t have any regular review and no judgment there? Or it could be on Thursday, not on Monday also.
Yes, yes, don’t stick too much on the money, yeah, could be any day. We don’t judge, we don’t judge. So, oh, it looks like nobody’s using spreadsheet. And okay, we have a mix of everything, I would say. We don’t have regular review Some of the Which is expected as well. Yeah, yeah, I think that’s what we were expecting there. So, after this webinar, you’re gonna have one thing Yeah, then we asked the poll again in a few weeks. All right, so let’s get started. What is Klient Insights in a nutshell? So it’s live dashboards in Klient PSA based on your Klient PSA data. So your projects, your people, time and billing
Everything in Salesforce. We have 19 pre-built dashboards built for service teams specifically. You can change them on screen, no reports to build. I think one big question is, Yanick, like, why did we build Klient Insights if you had to explain it Again, it came from one of you guys, or one of our customers, Rebecca, from one of our customers, presented me with an ask from their team, and it was a good report. And with the limitation we had in the past with the Salesforce report, you So to build a dashboard, you need to base yourself on a Salesforce report. There is limitation on what you can join together. Klient has a lot of objects. So we end up with limitation whatever we wanted or not. So rebuilding a new engine was the sole solution
So we rebuild that new engine, and now everything’s fixed, and it’s bringing even more layer in this age of visualization and and being able to expose some key data that hopefully I’m going to be able to showcase today. I think key is like ease of use because a lot of not everybody is as versed in Salesforce reports and dashboard and we get so many support cases on that. So hopefully it’s simpler after today. All right, so that’s the why. Now let’s see it in action. Most weekly reviews come down to those four questions that we put on the screen, and that’s what we’ll address during the demo. So are we making money on this work
Who’s on the bench are overbooked? Where is revenue leaking, and what will slip this week? If these sound familiar, then you’re on the right webinar, because that’s what we’re about… what we’re about to answer in the demo. So in the four demos, we’ll show you some dashboards, how to run your meetings from them, how to build your own, etc. And feel free during that section to, like, add questions in the chat. We’ll address them as we go if they’re relevant, of course. So Yanick, let’s get started with the first demo.
Yeah, so good for a question to ask, and then we’re going to start with one of the most important one. Are we making money with our customers? And to look at this, what we’re going to be looking at is our Klient Insights. And when you land in Klient Insights, you land in my dashboards And we’re going to cover this in a second with the mention of the plea you’ve just talked about. But it compacts with 19 templates, and those templates are built with one purpose in mind. It’s to help you grow your business. So in the first one we’re going to be looking at, it’s the account and project scorecard. So looking
specific accounts to see if they are generating more or not. I like to see my dashboard full screen, so I’m going to try to always remember to put myself in full screen. And this is one of the components I like the most because it brings everything into one. This is also an innovative one. I don’t think this exists a lot on the market. And the key thing is that you can go along and you can easily sort and focus on what’s important, which customer are you losing money on And you can see here that we have those three in the red. And the key cool thing is that as you go in and want to investigate and dig in, you can just click on it and you can use control click to select multiple. And what happened is that you are building up and you can see Rosalie, have you seen that? It’s also changing the controls
It changed here my top controls and turn the icon I’m selecting, and here it changed my dashboards or my insights because this is not only a report, it renews insight, and that’s a key thing. And you can focus on that insight right now. So for Smile here, what we have is that we have 114 tasks overdue. And the last time we’ve logged hours on it, it’s seven months and there’s 10,000 unpaid invoice amount. So it’s kind of a lot of information. And that’s telling you exactly what you need And in this case, what we can see is it’s one active project is in the red. So this is per account. It’s not looking project individually, and it’s still resurfacing. So that inside
And if you want to dig in even more, then you have all that information you need and all of this is configurable, as you will see later on. But you can see here that, for example, there’s 24% we’re leaving on the table. So we’re logging one out of four hours of billable, so 24% is left on the table, and we have unpaid invoice amount for the last 15 months we haven’t received or sent an invoice. So there’s a lot of key insights that can be resurfaced And if this is not enough, you can even go deeper and see per project. Sorry. So the bottom
graph is the same thing, but this time per project, and you can filter and sort again with those one. Isn’t this magical? So do you imagine how many reports you need to dig in on Monday if you want to get to that kind of level, if you don’t have this or in the past with what we had, it’s a lot of information. And this is all live data as well. And I really personally really like the account side-by-side because you will get the full list, but sometimes it’s really, I want to check the big accounts or these specific ones, and then you can have it all in one view. I love it.
Yeah, exactly. And if you just Yep, exactly. So this is beautiful. I love this component. This one is called the compare component. We can come back if we have time later on. Yep. Second one, where our revenue is leaking. So let’s for this one, we’re going to be looking more on the revenue side. So if I’m coming back to my, I’m going to accept my full screen. I’m going to come back to my insights. And for this one, I’m going to scroll to my revenue dashboard and my finance side of things and please do explore all of them. They’re all created for that. So open them. They’re going to show surface all your information you have in your system, and you can have filters, as you can see here on top to reduce the amount
And we’ll see how you can save your copy later. For this one, what we want to be looking at, it’s what we’re leaving on the table. So in this case, for the past year, we left on the table billable time for 664,000 So 3,500 hours, so equivalent pretty much of two person for an entire year have not bill invoice. And you want to know why, and you want to be able to dig in. So those dashboards are built with that in mind. So they will resurface that information and you can see clearly that the biggest of those projects that’s causing problem is this one here
And the key thing in the dashboards is that pretty much everything can be clicked on and you can… the information can be resurfaced, so you can see that indeed, there’s a lot of timesheet involved and perhaps if you need to dig in a bit deeper, you can click in and go in the Salesforce record itself with the standard view With the standard view, With the standard view. And yeah, so clickable. Most of our component are clickable, so you can begin and resurface the information and then you can go in the Salesforce regular record to see even more
What about you, Rosalie? Does it help you out? Do you find it useful? You just did Yeah, and so far, if people can give us thumbs up or thumbs off, or are we on track, is this what you were expecting from the webinar? Is this, like, lighting some light bulb on your end? Like, is this what you were expecting or not? For me, yeah, but it’s nice. Let’s not wait until the end of the webinar to figure out if people are like, what is this not useful or yes, it’s what makes sense so far. Hopefully. Thank you.
And Rosalie just completed our e-learning, so I’m sure we’re going to talk about it later, but we have an e-learning to… you can follow and go through it. So, and in terms of revenue falling through the crack, there’s another one that I love data health. It’s on the admin side of things, but open it up And you’re going to see here what it resurfaced. So it resurfaced the live project without the budget. The project that I’ve gone stale. So the project that have due date in the past So they can all be resurfaced in one single view. After that, you have time.invoice, billable hours at no rate. This is also a tricky one that quite often when you didn’t start your project properly. So this should be checked once a week, once a month on the schedule, eventually by your agents. And generally we’re going to show you how you all agents can check this as well.
But this is a gold mine. Is that the word? There’s a gold mine, a gold mine of information that you can just, again, dig in and go deeper. So this is project that I helped that’s going to be very useful as well for you guys Third one Play. So random eating, press play. So it’s about visualization. We’re going to hear more and more about this. We’re going to the Netherlands. We’re going to also announce a new project, product of ours in the Netherlands. Sorry for hitting the wrong button And it’s all about visualization and bring things to life and really focusing on key information. So in Klient Insights, if you go in my dashboards, or if in any of the template, you can mark them as your favorite, and they’re going to end up in your favorite section
One also nice details touch, I believe, that you can see here what you see. It’s really a mock-up of the dashboard that’s underneath. So every one of them is as a different layout because it’s a real mock-up of the underneath dashboard. So you can see, for example, the we’re going to see this one later, the resource utilization We have a lot of heat map in this one, while in the accountant project scorecard, we had that compare view that Rosalie. So those are mock up to give you an idea what’s in
So those are not random images just put by AI in there, Yanick. That’s what we want to talk about. That’s what I’m trying to say. There’s effort All right, so if I go back to my dashboard, you can see now that I have my dashboard here that’s been identified as favorite, and I can press that play button and line them up. Okay, so I’m going to line them those four dashboard, and then I I can play them and playing them, meaning that in that morning meeting, I don’t need to build a deck. I just need to do play, and then I can come in, put that on screen, share my screen, and just talk about those numbers.
This is what we look at, should look at when we’re talking about any number of our business. So we’re going to start with that portfolio health document that I made a copy of to change the filter for my specific need And this one, I have 102 active project, 10 of them are at risk. And then I can see my spent. I can see which one are ending in the next 30 days. So there’s so much information that can be resurfaced. The idea is to focus on the important one on top And then we have one with resource utilization. So who’s busy, who’s not, who’s working too much, who’s making overtime versus what their schedule. So this is what you see on here on the left. Purple line is log
The gray line is what their schedules say they should be working or what they have not worked. It also gives you the capacity. You can easily see who are your resources if they are in the sweet spot that you’ve defined for them. We’re coming again with a lot of ramification about the target utilization that’s been asked for our customer What an unfilled demand. So it’s really everything at once, depending on what you want to see during your review meeting. Do you want to look at that project budget and burn that resurface information like the burn down. So we ingest all the Snap information into Klient Insights as well with the Snap dashboard, you have access to dig in and changing the lands and flipping stuff.
Snap dashboard is still very useful. This can also tap in into the snaps and resurface that information with the same kind of we’ve recreated as well the burndown component we add on Snap. We’ve brought it in here as well. So you can use both for different purposes. But again, this one is interesting with a different component, such as the weekly cost by role. So you can see where are the different roles that you are most paying across your business And you have a ton of tables that calls who can represent information, including pass on the run, meaning what you have was scheduled and you have not worked on or that you have worked more than what you were supposed to schedule on
So at one glance, at one dashboard, you can see all that information And just to come back to it, this is the one that we’ve started with, with the billable net time and net invoice. What usually come up as well is that to do a segue to our next slide, Rosalie, is that quite often, maybe you’re missing some information in the dashboard and you want to be able to add it, right? So this is where our next demo is going to be focusing on, showing you how you can easily edit all of it. So as you can understand from that screenshot, you’re going to have a manual edit, but
In the day and age we’re living in, living in, we’re gonna more likely use instead AI to do our editing. So this is where we’re going to talk about GUIDY1. And I’m going to start by opening up this revenue and billing report And before using GUIDY1, I’m just going to make a copy of my report so you can easily see now that I’m working on a copy of it. And I’m going to start GUIDY1 Which is one of the agent. We have a free promotion for you if you stick around for the next 13 minutes, you’re going to know about how much it costs, which is not nothing. So you’re going to be able to have access to GUIDY1 if you stick around till the end
And let me just find my small post that I have here. So the teammate asked us, like, we’re missing something on top of that dashboard. We need kind of a table of the top clients with billable time that’s not in voice That should be resurfaced. So now this is what our agent can do. They can really go in your dashboards. They can go in your environment and they can help you structure all that information and they can do some action. So I was not using my hands. It’s not a recording And GUIDY1 just added me that component. Okay, maybe it should have made it a bit more compact, so I’m just going to do that part myself. So I’m just going to edit my dashboard just to bring back maybe that component on the left side
But you can see that GUIDY1 can itself add stuff and it understand a lot. It’s surprising that what you can do when you’re talking about, I want to measure my margin. I want to group my account, or I want to add a pie chart group by. So we’re going to do all of this. And actually, what I want to show you even better. So let me clear that conversation. And let me give her a bigger prompt. So She can even build you a full dashboard from scratch, or you can point her to a template to modify it, or she can build just by your requests. She can do it from scratch. So in this case, because it’s a new dashboard, she’s going to ask me questions
You’re gonna ask me a question. However, we should address to our agent. And if I just roll back up, you can see the architecture she decided to go with. So three components, one heat map to one bar, two bar chart. So she’s building it So in this case, I still need to go back to my own to get my new dashboard that’s going to be created for me, my bench and booking that she just created with that new With the data in it, so now I have my heat map being resurfaced and I can see my information across whose book and whose not book across my different week
Yeah, so this is the kind of thing that you can ask GUIDY1. We will be talking about the offer, but you should install it. There’s a lot more that you can do. We’re going to talk about that, I guess, in maybe another webinar. I’m not sure if it’s going to be a product one, but she can onboard you a new feature So you’re going to be able to ask your onboard me on Klient Insights, and she’s going to bring you through a list of steps to get you on board and get you to be able to edit this. It’s all good with agent, but you, like I said, you can still do things manually. So you can exit those dashboard. So we still have some room for us for things to do as human. And you can drop those components here on the left side. You can take any kind of component and you can drop it
And then you can decide which object you want to draft or use. And you can see we try to group on most use object, things like that to simplify your life Then you’re gonna be able to add columns to your reports and to your, not reports, but to your engine, to your graph engine. And then you’re going to be able at the end to run the query based on some of the filter. And at the end, what it does It returns an SOQL query that’s going to be returned in that case. So let me go back to one, maybe one graph that has some data. So, and this is what it’s unlimited. So it’s running an SOQL queries. So anything you have in the system, you can plot, so you can really adjust the way you want
Based on those. And then on top you have the visualization that you can select. So how do you want to represent your data so you can easily switch through how you want to represent your data or show your data with the different components. Plus, you have different formatting, including color teams And then title, subtitles, so basic graph stuff. So it’s as you can see, it’s a full-fledged graph engine that you now have in your end part of our license. We don’t ask you more. That’s all part of our package that you all have
And so, Philippe, we’re going to be able to use it and make good use of it because there’s a ton of insights in it And if I can add to it, I think this really fills the need as well. I know some people, some customers, depending on who I’m talking to, are scared of a Salesforce dashboard as well. And it’s really just a subset of their team that knows how to use it properly and build reports. So there’s often like a really long delay between, oh, I need this visibility and data and like Getting it to actually show you, I think this just, like, closed the gap. You have the idea, you know what you want to see. You just chat with GUIDY1, say, I want to see this done, or you just build it that way. So I think the… it’s quicker, it’s better. Sometimes this full list of all the objects confusing, just ask GUIDY1
I’ve tried all I prefer that way to build stuff, but… And upcoming about GUIDY1, it’s really that agent that’s going to guide you and onboard you. So that’s also your future helper. Now she can help you with those, but she’s going to be able to help you with a lot more in the future. All right Perfect. Moving on to the next section, I just wanted to do a quick poll. So let me just pull that here. This is the full list of all the dashboards that are available. They’re also in the platform, of course, but in case you’re not updated, upgraded to 51.13
Put a little star next to the one we recommend using first, and then just out of curiosity, we put a poll as just a list of the general dashboard. We’re just curious to know, after you’ve seen on that, are there, like, specific topics that you’re like, oh, this is one I would build first. That was probably the one that was missing from your current stack of reports. So take a few seconds to answer that. Which ones you’re more excited about. And then let me just pull to, I guess, oh yeah, one thing we did want to mention after you had a test of Klient Insights, have a look at ideas exchange section on the feature hub and log ideas. If there’s anything missing, any option you wish you had, just log them there. We always say like the closest to the release
dates, then the more likely it is to be incorporated in the product. So if you wait 6 months, maybe we still do it, but it’s just less top of mind for the product team, I would say. All right, thanks for answering the poll. I appreciate it. All right. Okay. So you watch the webinar, you’re like, oh my god, this is great, I want this ASAP, I’m ready to go. Okay, so what do you need to do on your end? First of all, make sure you’re on 51.13 by now, you should know how to do that. So first thing, check permissions. If you’re using out-of-the-box permission, you should be fine. It’s already included. If you’re using custom permission, just have a look at our admin guides and make sure you add those
for people to have access. Then start with four. So where do you start? Go there, create the dashboard or like create a copy of the dashboard. So those are the four we recommend. Of course, whatever you prefer, start with that. And then make it yours. So either use GUIDY1 or use the edit and then change, tweak it so it matched to you My best thing, I didn’t show it what happened? One thing we didn’t touch on, we did talk about the play function. So that’s a very good way as well, if you do end up building a few dashboards, play it with your team. So the team shows kind of what Klient Insights is. Yeah, but then there’s the share option as well. So you can also share it with your team. There’s a few ways to do that. I really like the copy paste is just like one click copy paste. I don’t know if you can show that as well.
When you’re editing The share options, yeah, so the meeting, yeah, you have the play, we show that, but when you’re in a dashboard, if you just want to, like, you build something, it’s nice, may want to share it with people, not sure why you can share that one, but This one is a template. Yeah. Yeah, usually there’s a… yeah, exactly. So there’s a little window so you can share with other people. So if you end up after today, you build your dashboard, share it with whoever so they can have access. And there’s some things they will see differently as well, because it’s depending on what the…
the view is, if it’s based on my task, then obviously they will see something different. We have a few FAQs and, like, frequently asked questions about, like, what people will see in Klient Insights, so I encourage you to check that out in the Feature Hub. But yeah, the share option and even just the share, like, copy one, I think You have that one if you click on the share button, or not Yeah, it’s here in the copy link. Yeah, that one, you have the link, and also just, like, copy-paste earlier, I was testing it. If you just want a slack an image, like, I want to slack this dashboard to my friend, I just copy and then just put it in the Slack. So that’s pretty cool, too.
Yeah. There we go Yeah, so you can also share that. And then the last bit, once you’ve done all these for getting started, would be the GUIDY1 portion Yes. All right, okay. There we go. All right, a little bonus. So GUIDY1 here. So what Yanick just showed you, GUIDY1 is free. We’re making it free until tomorrow, end of day. So if you’re watching today and you’re like, oh my God, I want to build my Klient Insights, I want GUIDY1 to help me do it After today, all you need to do is go to My Products in the Feature Hub, if you have that permission, and then just add GUIDY1 for free, and then you have access, download the package, that’s it. You can start using it. Just keep in mind, you do need to have some Salesforce flex credits
If you don’t know what I’m talking about, ask your AE, your Salesforce AE. But if you do have them, then you just need to set up GUIDY1 and off you go. We have documentation on GUIDY1 as well in the Feature Hub. So yeah, and then have a fun play with it. And please, please, please share your feedback Yes. Good or bad? Yeah, all right, perfect. As I mentioned, we have a few documentation. So we have an e-learning specifically on that. I do encourage you to share this webinar with people that are interested, but also the e-learning. We have all the start guide, all the admin stuff and a bunch of, yeah, we are going to include all the links to that in our follow-up email as well. And I think Nathalie is dropping them in the chat
As I talk. Perfect. Next slide. Perfect. Just a few updates we just wanted to mention. Feel free also after today to ask KLARA about Klient Insights any question you have following this webinar, of course, you can reach out to us, but just ask her. I already see people that are buying it. All right, so we have that, and then just a little reminder, because we briefly talked about it on the last webinar, but Salesforce Backup and Recover, if you are interested in knowing more about that, just reach out. It’s relatively new.
And then lastly, I think that’s the last. Yeah, just putting it on screen, upcoming events. So we have in two weeks our November product update on 51.14. November 26th, we are in Amsterdam. I think we’ve mentioned it for like months now, but it’s happening finally. And December 10th, so it’s a bit earlier in the month because, yeah, we have holidays. We’re having our product update last one of the year. Yay! All right. With maybe some vision of what’s upcoming. This one might be one of the most interesting one might be this or are we going to split it?
The most excited. It’s always the most exciting one. We say that every time, Yanick, this is going to be the best one. The most exciting. Brace yourself. All right, if you can take a few seconds to answer the webinar feedback. Also, it was a bit of a different format. It was shorter. I was on one feature. Let us know what you thought, if it was better or worse than usual. We always read your feedback. And I think that’s pretty much it. We didn’t have many questions. Maybe people are digesting the information or already buying GUIDY1 and getting started with Klient Insights during the webinar.
I see it popping on my screen. There’s people buying it. Or free. Yeah, so, yeah, if you’re already on 51.13, maybe you are looking at Klient Insights while we were doing the webinar and doing it at the same time, that’s great. Thank you so much for being here, hopefully we see you on the next webinar, and you can expect a follow-up email in your inbox. Yanick, did you want to add anything else Thank you for being here. Enjoy GUIDY1 and the insights. All right. Have a great rest of your day. Bye-bye.
Free download
Download the webinar deck
Get the full slide deck from this session — we'll email it straight to your inbox.
PDF · free · no spam