KLIENT FEATURE SPOTLIGHT
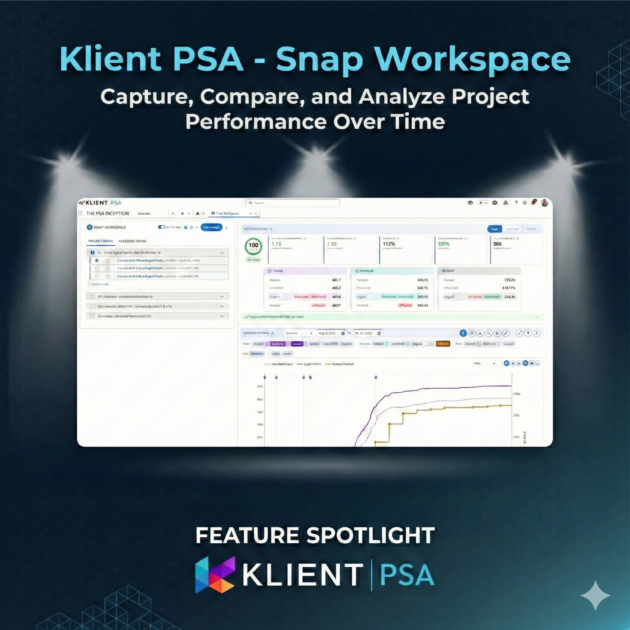
Snap Workspace: Capture, Compare, and Analyze Project Performance Over Time
Track project health with Snap Workspace. Create snapshots, monitor SPI and CPI, and visualize trends with six interactive charts in Klient PSA.
Project data lives in the moment. Task statuses change, hours accumulate, costs shift. By next week, you’ve lost the snapshot of where things stood today. Without historical preservation, you’re managing projects blind to how you got here.
Snap Workspace solves this by capturing point-in-time snapshots of your projects and turning them into visual analytics. Track progress, compare baselines, and identify variance before it becomes a crisis.
What is Snap Workspace ?
Snap Workspace is a Salesforce-native analytics tool within Klient PSA that captures project state at specific points in time. Each snapshot preserves hours, revenue, cost, and task data in daily granular records. You can then visualize this data through six chart types, compare snapshots to baselines, and monitor key performance indicators.
Unlike static reports, Snap Workspace provides interactive charts with toggleable layers, filterable data, and multiple visualization modes for different analytical needs.
How It Works: Capture, Compare, Analyze
Snap Workspace integrates directly into your Klient PSA workflow. Create snapshots from existing project data, then use the dashboard to visualize and analyze performance over time.
See Project Health at a Glance
The KPI Dashboard shows the metrics that matter most: Schedule Performance Index tells you if you are on track with hours, Cost Performance Index shows budget status, and the composite Project Health Score gives you a single number from 0-100.
No more digging through reports. Open Snap Workspace, select a snapshot, and immediately see where your project stands.
Compare Snapshots to Spot Trends
Select up to six snapshots to overlay on your primary view. Each gets a distinct color so you can track how metrics have changed over time. Answer questions like: How did hours compare between last month and this month? Are we trending better or worse than the baseline?
Six Ways to Visualize Your Data
Different questions need different views. Snap Workspace includes six chart types:
- Multi-Layer View — Stack hours, revenue, and cost data with toggles for planned, scheduled, logged, and invoiced amounts
- Resource Heatmap — See resource allocation as a color-coded grid with drill-down capability
- Scheduled vs Logged — Compare what was planned against what actually happened
- Utilization Rate — Track resource utilization percentages with FTE stacking
- Variance Analysis — Highlight deviations from baseline to identify where things went off track
- Burndown — Monitor remaining work with health-based color coding
Key Benefits for Project Managers
The composite Health Score provides a single number from 0-100 that combines schedule performance, cost performance, and other factors. See at a glance whether a project is On Track, At Risk, Off Track, or Critical.
Compare any two time periods to understand how performance has changed. Identify patterns like end-of-month hour spikes or gradual budget creep before they become problems.
Estimate at Completion (EAC) and Estimate to Complete (ETC) metrics help you forecast total project costs based on current performance. Make informed decisions about resource allocation and budget adjustments.
VIDEO
Screenshots
RELATED DOCUMENTATION
– Read the Release Notes
– Explore the FAQ
How Project Managers Use Snap Workspace
Consider a typical weekly project review. Before Snap Workspace, gathering the data required multiple reports and manual comparison.
The Traditional Workflow
Without point-in-time analytics:
- Run reports manually each week to track project status
- Export data to spreadsheets for comparison
- Calculate KPIs manually or skip them entirely
- Struggle to answer “how did we get here?”
- No consistent metrics across projects
Time-consuming process with limited historical visibility.
With Snap Workspace
Point-in-time analytics built in:
- Create snapshots with one click
- Select snapshots to compare visually
- KPIs calculated automatically
Immediate insights with full historical context.
What Changes
Snap Workspace transforms project reviews from a data-gathering exercise into an analysis session. Instead of spending time collecting information, you spend time understanding it.
The feature is additive, meaning it works alongside your existing Klient PSA setup without requiring changes to your current processes.
Teams that adopt Snap Workspace report faster identification of at-risk projects and more productive status meetings. The consistent KPI framework also makes it easier to compare performance across different projects.
Ready to see how your projects are really performing?
Project Agent FAQ
Reports show current data. Snap Workspace captures point-in-time snapshots so you can compare performance across different dates. The KPI dashboard also provides calculated metrics like SPI and CPI that would require complex formulas in a report.
Each Daily_Snap__c record is approximately 2KB. A project snapshot covering 90 days with 10 resources creates roughly 900 daily records (1.8MB). The storage indicator in Snap Workspace helps you monitor usage.
The current release supports manual snapshot creation. You can use Salesforce Flow to call the snap creation service on a schedule if needed. See the Admin Guide for Flow integration details.
Deleting a Snap__c record also deletes all associated Daily_Snap__c records. Use the “Don’t Delete” checkbox to protect important snapshots like baselines from accidental deletion.
Yes. Use Project Aggregation mode to select multiple projects and see cumulative metrics. Each project gets its own snap selection, and the dashboard combines the data for portfolio-level analysis.
Found this helpful?
Here are some similar articles in our serie Klient Feature Spotlight
Replace all your tools with Klient, Salesforce #1 PSA platform
Run your entire SaaS and consulting business on a single professional service automation platform native to Salesforce!